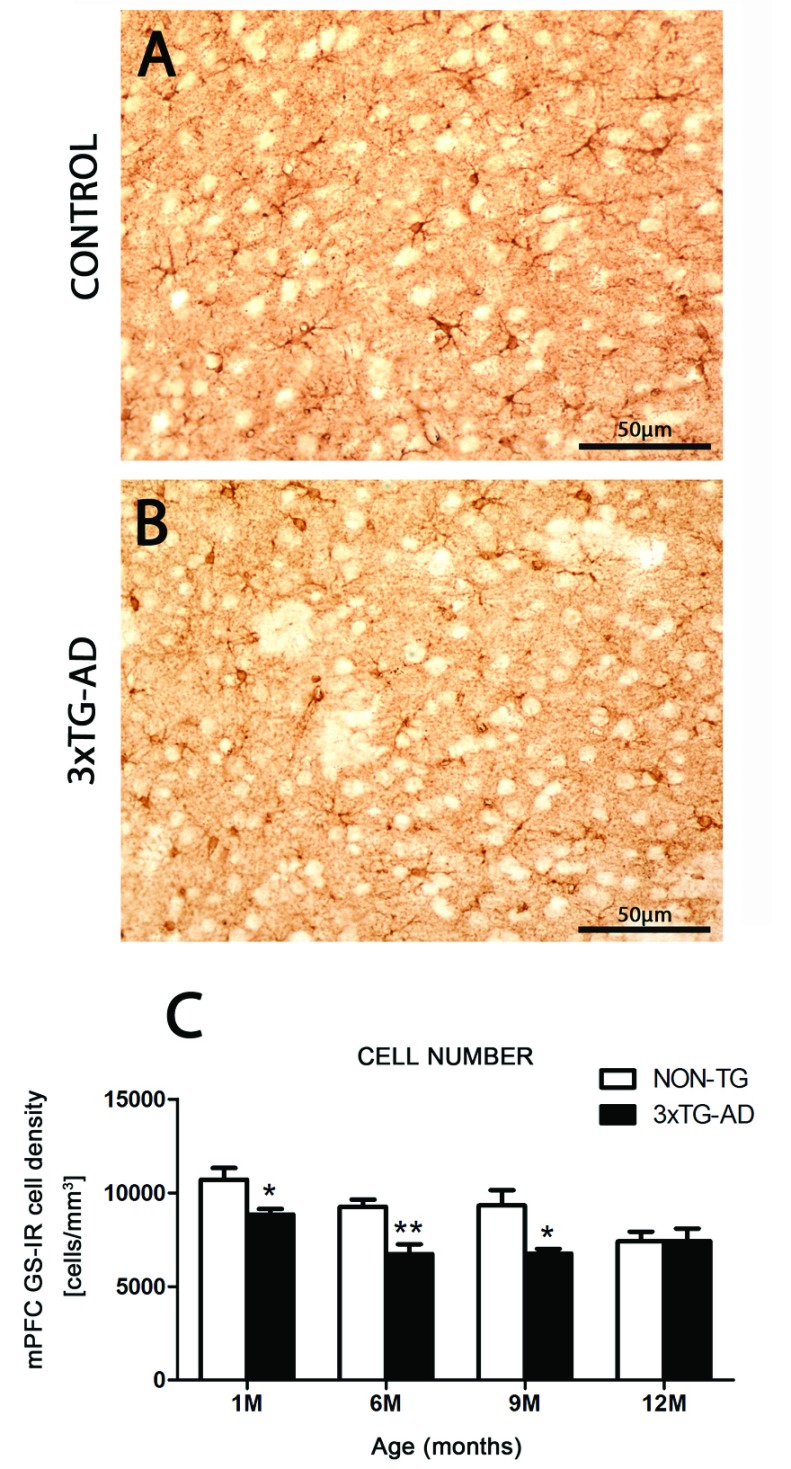
Figure 2. Differential distribution and number of GS-IR astrocytes between control and transgenic mice.
Light micrographs showing the distribution of GS-IR astrocytes within the mPFC in Non-Tg control (A) and 3xTg-AD (B) animals. (C) Histograms showing the numerical density (number of cells/mm3) of GS-IR cells in the mPFC of 3xTg-AD and Non-Tg controls. Bars represent means±S.E.M.

