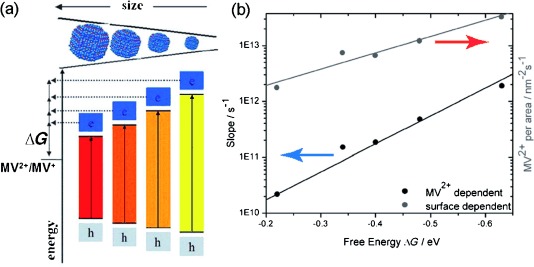
Figure 2.

a) Schematic representation of how changes in CdSe QD sizes affect ΔG for ET in the CdSe–MV2+ system. With the decrease in nanocrystal size, the electron and hole become more confined, widening the band gap and shifting the band-edge potentials. (b) The dependence of measured ET rates on ΔG. The rates on the left axis (data marked with the blue arrow) have been adjusted to account for the surface area of differently sized CdSe QDs. Rates on the right axis (red arrow) have been adjusted for the average number of MV2+ molecules per CdSe area. Both data sets follow the exponential dependence on ΔG predicted by Eq. (1). Adapted with permission from Ref. [99]. Copyright 2011, Wiley.
