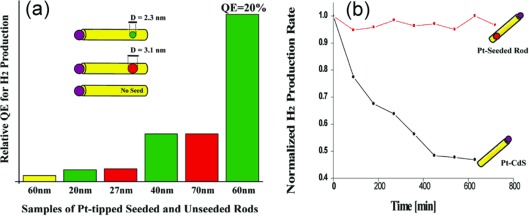
Figure 5.

(a) A bar graph showing the relative quantum efficiencies of H2 production measured from nanorod-Pt photocatalytic systems. Unseeded CdS rods are shown in yellow, CdS rods with 3.1 nm CdSe seeds in red, and CdS rods with 2.3 nm CdSe seeds in green. The average CdS nanorod length is given on the x axis. The highest H2 production efficiency was achieved with the smallest seeds and longest seed–Pt distance due to the best charge separation in such structures. (b) Normalized H2 production over time from Pt-tipped seeded rods (red) and unseeded rods (black), illustrating improved stability when the CdSe seed was present. Reproduced with permission from Ref. [35]. Copyright 2010, ACS.
