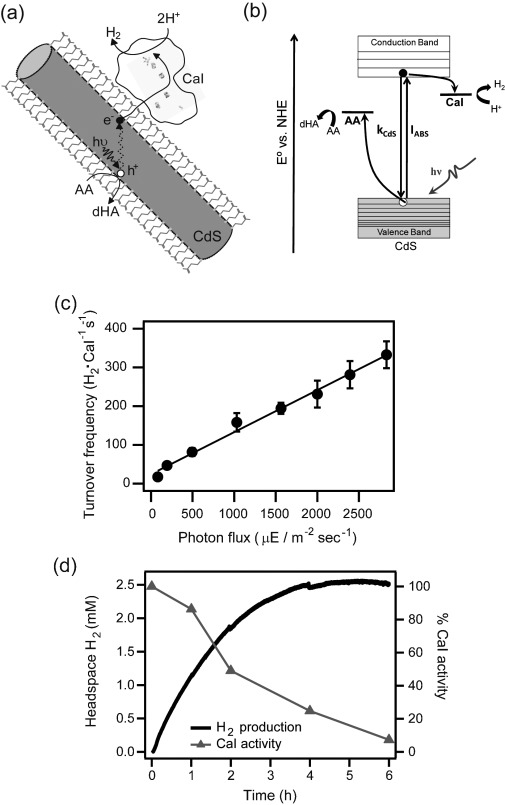
Figure 7.

(a) Schematic representation of photocatalytic H2 production by CdS–CaI complexes. CdS and CaI are drawn to scale, while MPA molecules are enlarged by about five-fold. (b) Energy level diagram for H2 generation. Photoexcited electrons transfer to CaI, while the holes are scavenged by ascorbate (AA). The competing electron–hole recombination pathways are denoted as kCdS. (c) H2 generation rate, expressed as a TOF, has a linear dependence on 405 nm photon flux. (d) Total H2 generated over time (solid line) and the corresponding relative CaI activity values (triangles). The data illustrates enzyme deactivation during H2 production. Adapted with permission from Ref. [38]. Copyright 2012, ACS.
