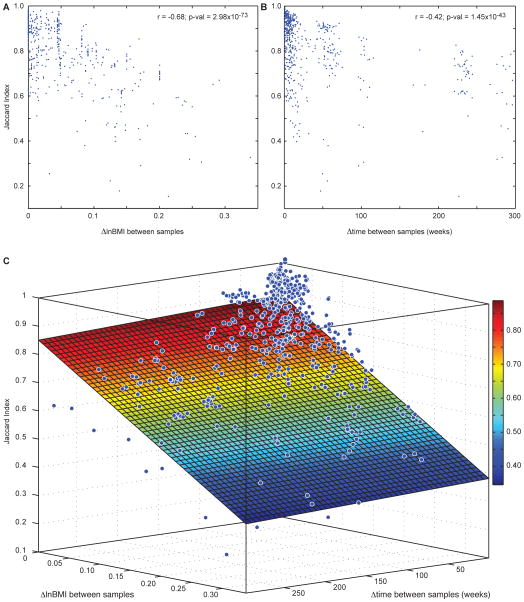
Fig. 3. Relationship between weight stability, time, and fecal microbiota stability.
(A) The microbiota sampled from a given individual during periods of weight loss or gain has decreased stability (lower Jaccard Index). (B) The Jaccard Index decreased as the time between samples increased (also see Fig. 2). (C) Across samples from 37 individuals, a linear model of microbiota stability as a function of changes in lnBMI and changes in time explained 46% of the variation in the stability of the microbiota (Jaccard Index). Note that changes in lnBMI explained more of the variation in microbiota stability than did the passage of time. Color changes correspond to the Jaccard Index values in the color bar on the right. Blue dots show the change in Jaccard Index, time, and lnBMI between two samples from a given individual.

