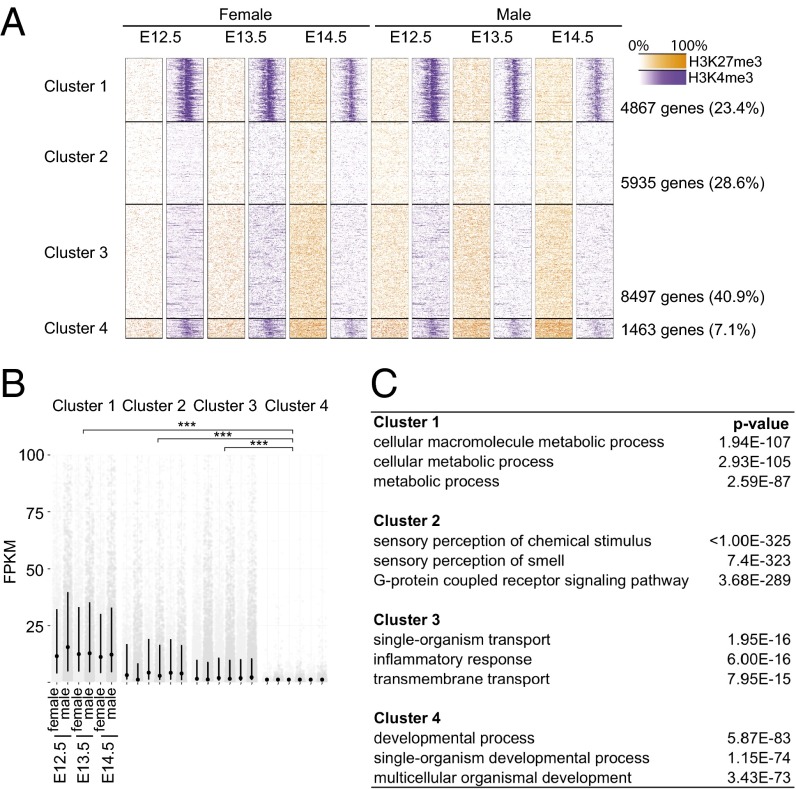
Fig. 2.
Clustering of H3K4me3 and H3K27me3 profiles with associated gene expression and functional enrichment. (A) Clustering of genes by similarity of H3K4me3 and H3K27me3 profiles 2 kb upstream and downstream of the transcriptional start site. (B) RNA expression levels for genes in each of four clusters. Each gray point represents a single gene; black dots, median; black lines, interquartile range. ***P < 10−15 (two-sample t test). (C) Top three enriched GO categories for each cluster.

