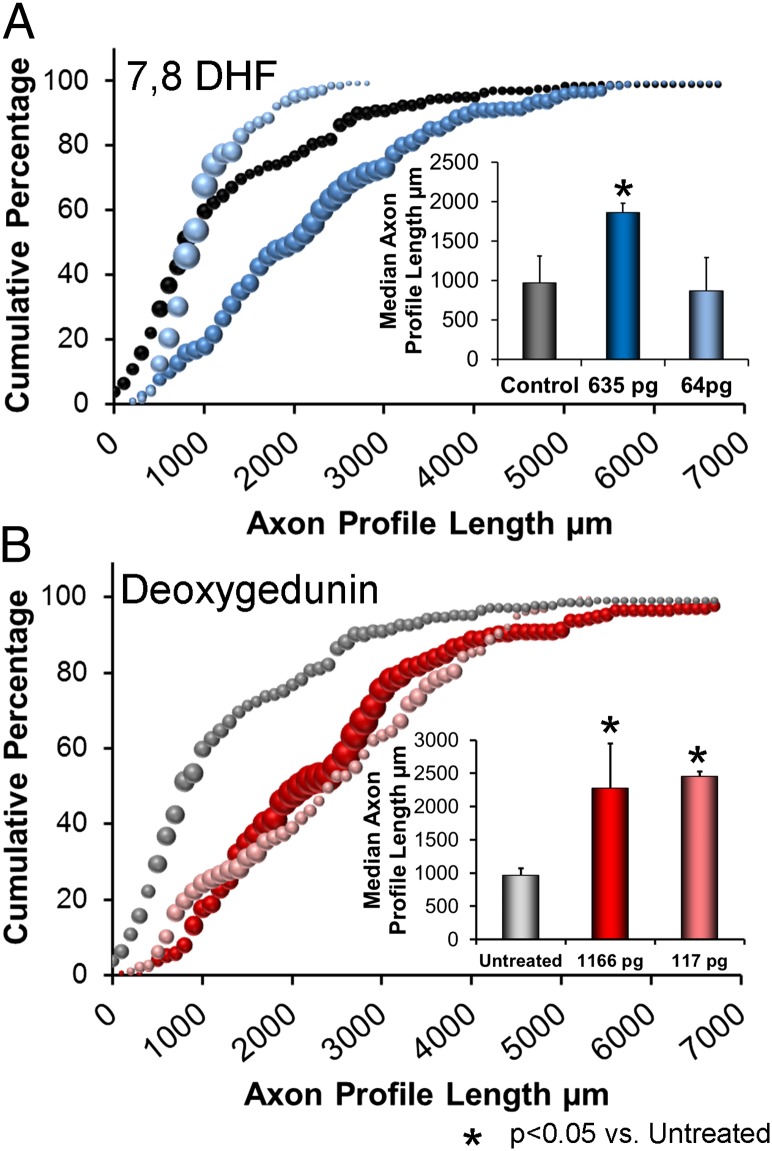
Fig. 1.
(A) Distributions of axon profile lengths measured in optical sections through nerve grafts used to repair cut mouse nerves are shown as cumulative histograms. Each symbol represents the average of four nerves, and the size of the symbol is proportional to the SEM for that axon profile length. (Inset) Average median axon profile lengths (+SEM) for the three groups (n = four nerves for each). (B) Distributions of axon profile lengths measured in optical sections through nerve grafts, as in A. (Inset) Average median axon profile lengths (+SEM) for the three groups (n = four nerves for each).

