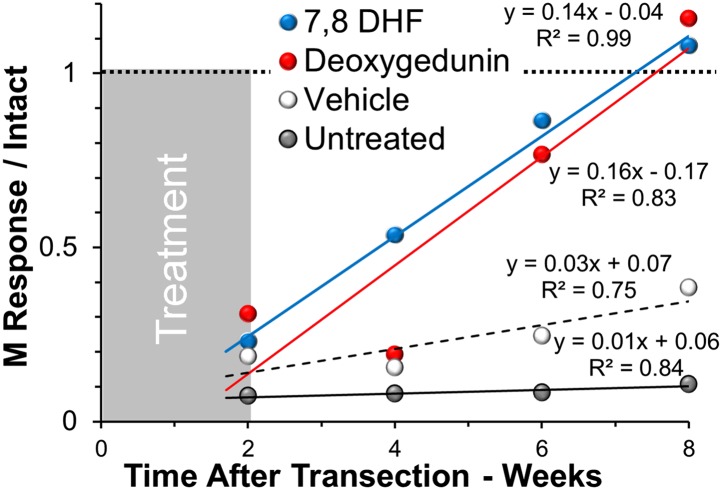
Fig. 5.
Average M response amplitudes recorded from the gastrocnemius muscles of mice treated systemically with 7,8 DHF, deoxygedunin, or vehicle, or untreated are shown at different times after nerve transection and repair. All data are expressed as a proportion of the maximal M response amplitude recorded from intact muscles. Slopes of linear least-square regression lines and correlation coefficients for each are shown. The gray area to the left of the graph is used to indicate the period of treatment. The horizontal dashed line at 1 represents the M response amplitude recorded before nerve transection.

