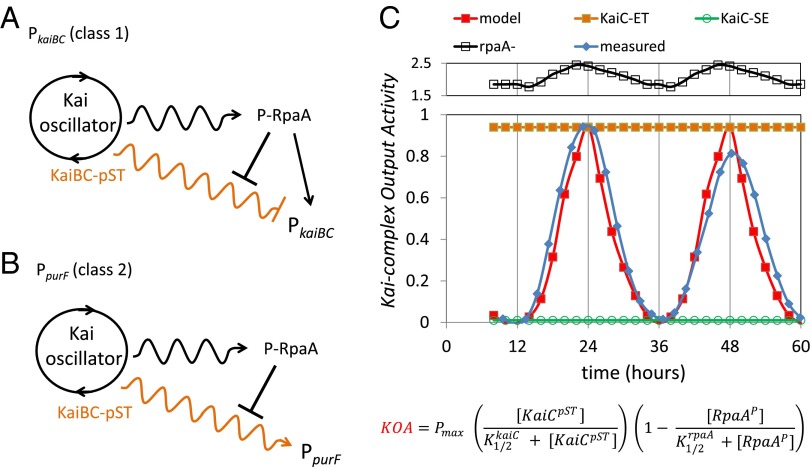
Fig. 7.
Simplified model of the central circadian oscillator and output activities. (A) Simplified scheme for the Kai oscillator output for the class 1 PkaiBC promoter. The standard model for the output response, involving modulation of P-RpaA via differential binding of SasA to KaiC dependent on phosphorylation state, can explain most of the observations. However, the discord between the level of P-RpaA and KOA necessitates the inclusion of a second, RpaA-independent output pathway as shown. This idea is similar in principle to a simplified version of the oscilloid model (22), in which we include an RpaA output pathway. For simplicity, we represent the KaiC phosphorylation cycle as a circle and highlight in orange only the KaiBC-pST state as the most active (see A above). Wavy arrows indicate that the “activity” is time-dependent in a circadian manner to distinguish it from a constant response indicated by straight arrows. (B) Simplified scheme for the Kai oscillator output for the class 2 PpurF promoter. In this case, the observations were not reconcilable with the standard model. Thus, we propose the unique scheme shown as a simple starting point to describe the behavior of the class 2 promoters. The model includes (i) a predominant RpaA-independent output pathway (orange wavy line) and (ii) suggests that P-RpaA represses this output pathway. It is somewhat satisfying that both of these effects were already brought into the revised model for class 1 promoter PkaiBC, indicating that behavior of class 1 and class 2 promoters likely shares much in common. Among those common characteristics are that the KaiBC-pST state is the most active in invoking KOA, which simultaneously suppresses PkaiBC (class 1) and activates PpurF (class 2). (C) Comparison of the relative values of KOA taken from Fig. 6 for PpurF (blue curve) and the simulation of the mathematical model using Eq. 2 (red curve). The equation for KOA is shown below. The simulation accurately predicts the time of peak KOA as well as the peak-to-trough ratio. In addition, by increasing the catalytic term or decreasing the repressive term, the higher levels for KOA found in the system with KaiC-ET (orange) and in the rpaA deletion (open black squares) were accurately described. By decreasing the catalytic term, the low values for KOA were reproduced for the KaiC-SE (open green circles).

