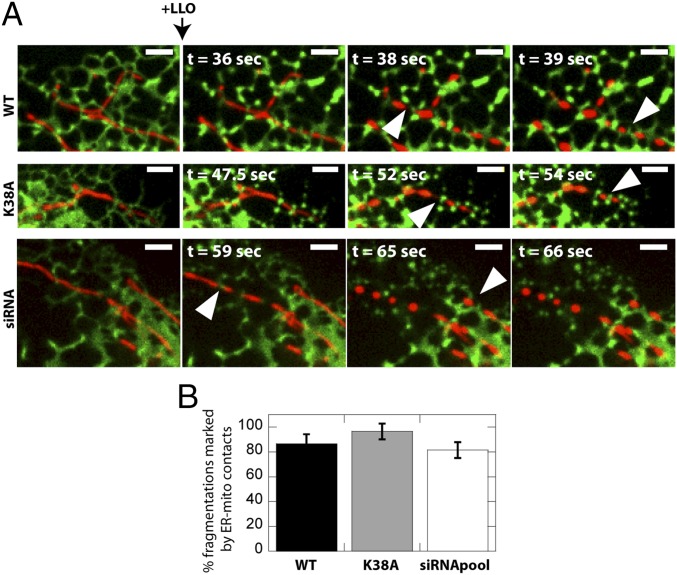
Fig. 4.
The ER marks sites of mitochondrial fragmentation independent of Drp1. (A) U2OS Sec61β-GFP cells were treated with 2 nM LLO and examined live by confocal microscopy. Representative images of mitochondria (DsRed2-mito; red) and ER (Sec61β-GFP; green) are shown. Arrowheads indicate mitochondrial fragmentation sites marked by ER-mitochondria contact sites. Experiments were repeated a minimum of three times. (Scale bars: 2.6 μm.) (B) Quantification of mitochondrial fragmentations marked by ER-mitochondrial contact sites. Analysis was carried out as described in Materials and Methods.

