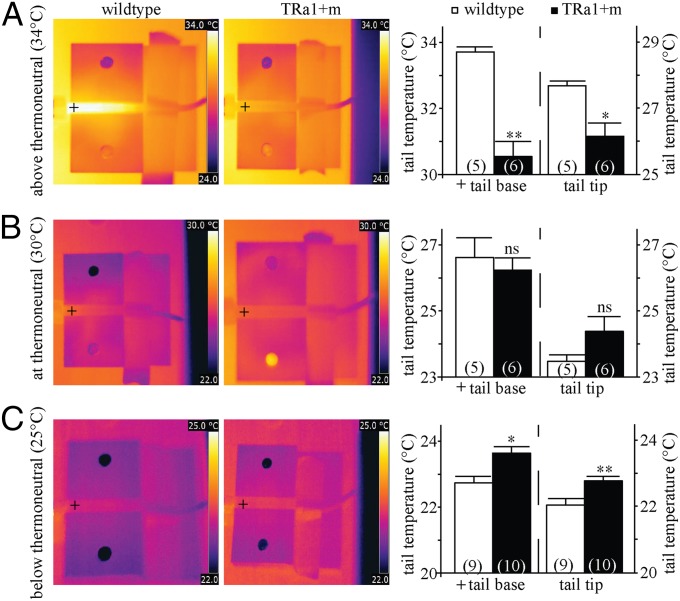
Fig. 2.
Heat dissipation from TRα1+m tails. (A–C) Infrared thermography was used to measure heat dissipation from the tail at environmental temperatures above (A), at (B), and below thermoneutrality (C). Crosshairs indicate where the temperature for the tail base was taken. TRα1+m tail temperature (black bar) was found to be significantly higher below thermoneutrality (C) (*P < 0.05, **P < 0.01) and significantly lower above thermoneutrality (A) (*P < 0.05, **P < 0.01) compared with wild type (white bars). There was no significant difference within the thermoneutral range (B) (ns, P > 0.05). The number of animals is given in parentheses in the respective experiments.

