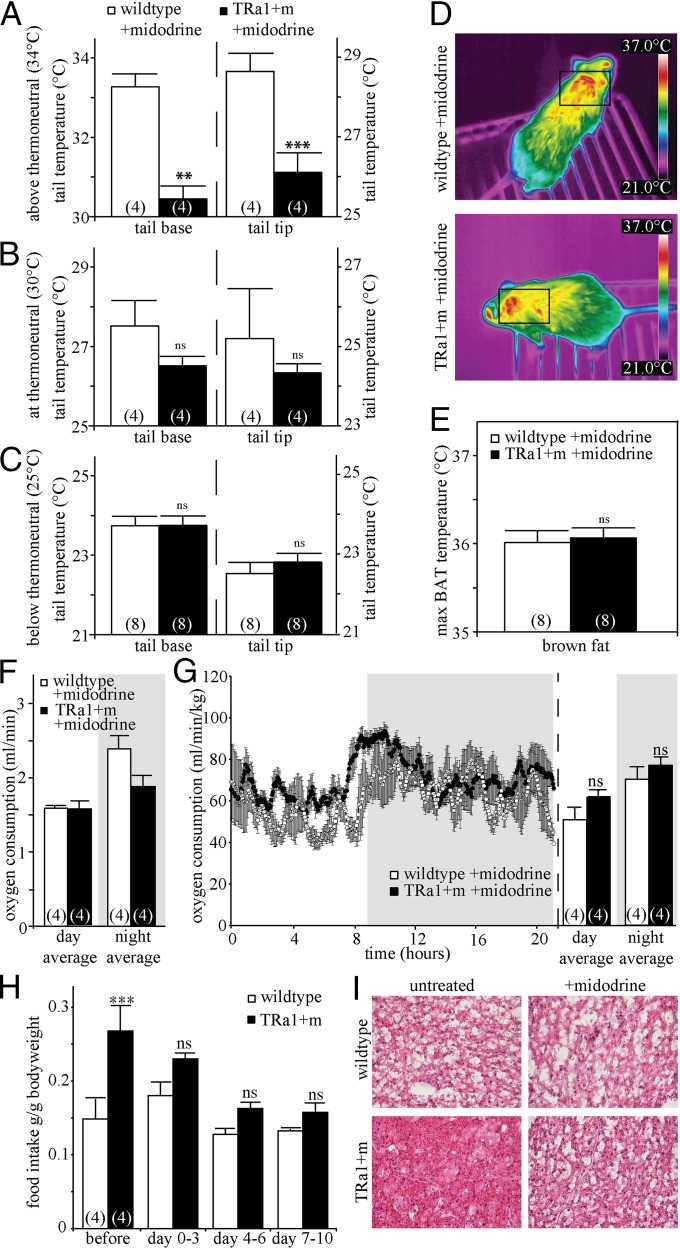
Fig. 5.
Normalized phenotype in TRα1+m mice after treatment with the α1-adrenergic agonist midodrine. (A–C) Infrared thermography was used to measure heat dissipation from the tail above thermoneutrality (A) (two-way ANOVA with Bonferroni post hoc test for 34 °C, tail base, WT vs. TRα1+m before midodrine, P < 0.001; WT vs. TRα1+m after midodrine, **P < 0.01; tail tip, WT vs. TRα1+m before midodrine, P < 0.001; WT vs. TRα1+m after midodrine, ***P < 0.001), at thermoneutrality (B) (all ns, P > 0.05), and below thermoneutrality (C) (tail base, WT vs. TRα1+m before midodrine, P < 0.05; WT vs. TRα1+m after midodrine, ns, P = 0.99; tail tip, WT vs. TRα1+m before midodrine, P = 0.06; WT vs. TRα1+m after midodrine, ns, P = 0.74) for tail base and tail tip of wild-type (white bars) and TRα1+m mice (black bars). (D–G) There was no significant difference between WT and TRα1+m mice after midodrine treatment in BAT temperature (D and E) (ns, P = 0.99) or oxygen consumption (absolute values in F and relative to body weight in G) (day, WT vs. TRα1+m before midodrine, P < 0.01; WT vs. TRα1+m after midodrine, ns, P = 0.14; night, WT vs. TRα1+m before midodrine, P < 0.01; WT vs. TRα1+m after midodrine, ns, P = 0.81). (H and I) The treatment also reversed the hyperphagia of TRα1+m mice (H) (two-way ANOVA for repeated measurements with Bonferroni post hoc test, WT vs. TRα1+m pretreatment, ***P < 0.001; other days, ns, P > 0.05) and largely normalized brown fat histology (I). The number of animals is given in parentheses in the respective experiments.

