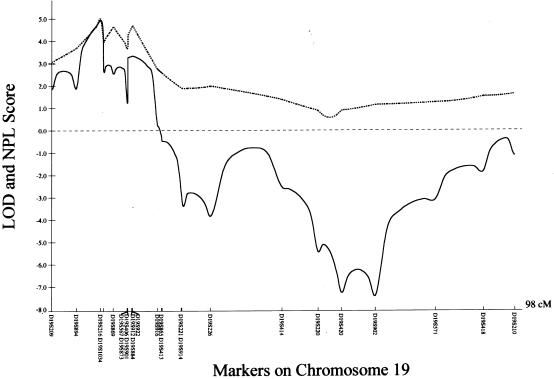
Figure 1.
Multipoint linkage analysis of AIS to microsatellite markers on chromosome 19. The X-axis represents the relative location of these markers, and the Y-axis represents the multipoint LOD (solid line ) and NPL (broken line) scores from parametric and nonparametric linkage analyses, respectively, for all seven kindreds.

