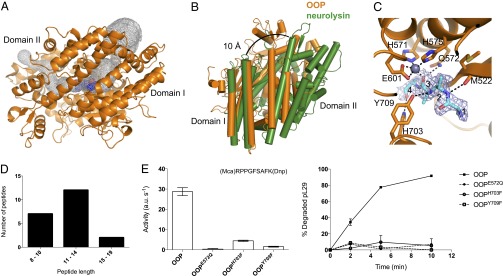
Fig. 4.

Structural features of OOP. (A) Overview of the OOP structure (orange) and its two domains, with the bound substrate shown as spheres (blue). The internal cavity in OOP is outlined in a gray mesh. (B) Comparison of OOP (orange) and neurolysin (green), superimposed on domain I, shows the possible path of opening. The neurolysin structure is opened by 10 Å at the top of the cleft. (C) Representation of the active site of OOP with the substrate bound in the structure of OOPE572Q modeled as a polyalanine tetrapeptide (cyan), with its electron density (2FO-FC, contoured at 1σ) shown in a blue mesh. The Zn ion is shown as a gray sphere, and the relevant residues in the active site are shown as sticks. Possible hydrogen bonds between the peptide and residues on the OOP active site are shown as black dashed lines. (D) Length distribution of the peptide ligands copurified with OOPE572Q (sequence of the peptides is shown in Dataset S2). (E) Activity of wild-type OOP and its variants carrying substitutions in the active site residues E572, H703, and Y709 analyzed by the degradation of the fluorogenic peptide substrate V and the presequence peptide pL29. Results are shown as average ± SEM.
