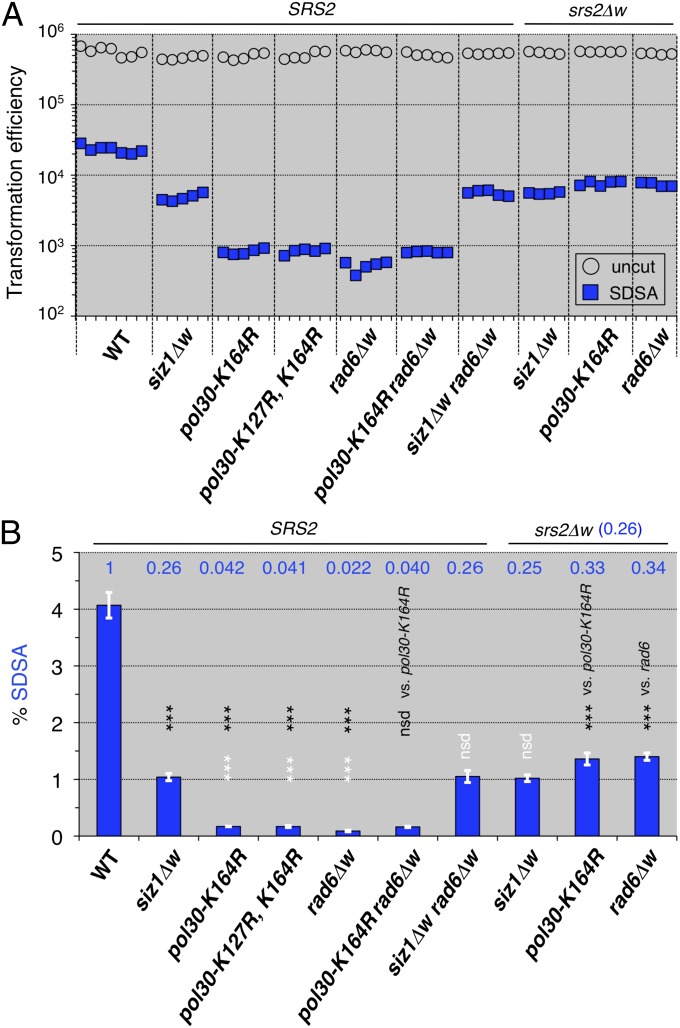
Fig. 4.
SRS2 is epistatic to SIZ1, POL30 (PCNA), and RAD6 (PCNA modification-related genes), with respect to SDSA. (A) Leu+ and Ura+ Leu+ (SDSA progeny) transformation efficiencies with uncut and I-SceI–cut plasmids possessing ura3-intΔisceI, respectively. (B) The normalized frequencies (%) of the SDSA events were calculated from the transformation efficiencies (Materials and Methods) and plotted (blue bars). Statistical analysis (Table S6): nsd, no significant difference; *P < 0.05; **P < 0.01; ***P < 0.001; two-tailed Student’s t test [black letters and asterisks, vs. wild-type (except for vs. indicated genotypes); white letters and asterisks, vs. siz1 mutant]; error bars = SD.

