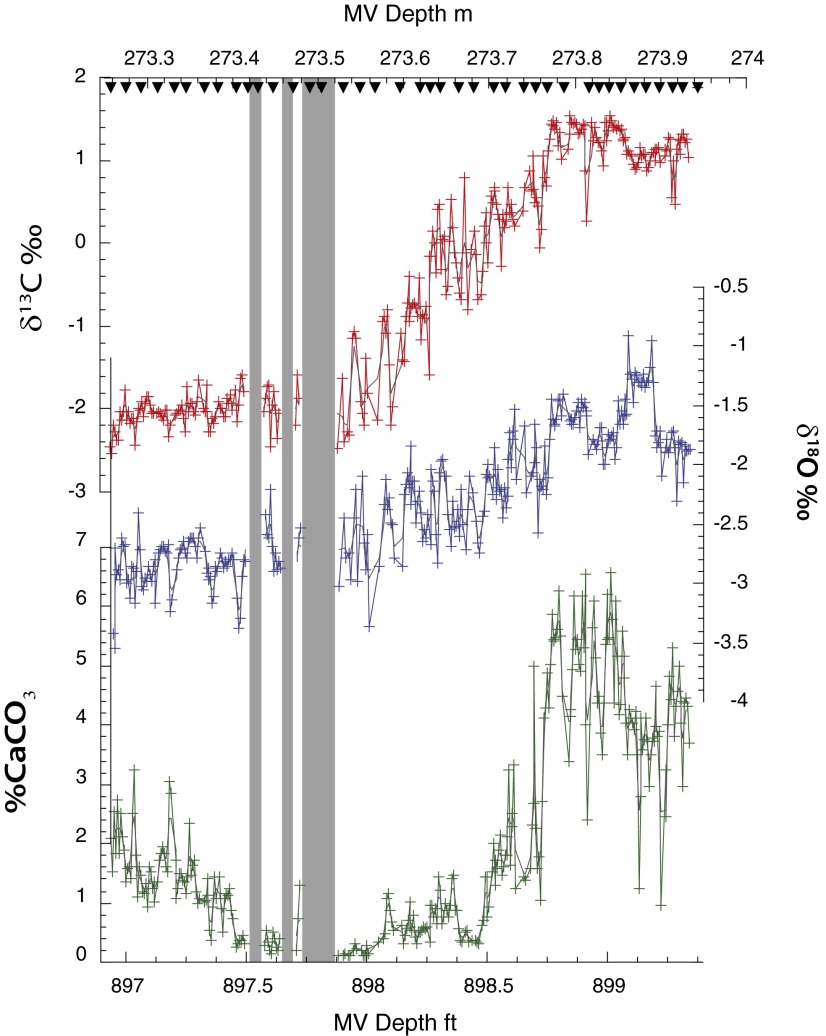
Fig. 3.
High-resolution bulk stable isotope and percent carbonate data from the Millville core (IODP Leg 174AX) through the onset of the CIE. Depth scales are in meters (Upper) and feet (Lower; the drillers used 10-ft drill rods and feet units are preserved here to facilitate comparison with the original core descriptions). The δ13C (red), δ18O (blue), and CaCO3 (green) records were generated by sampling the slabbed Millville cores at 2-mm intervals. Intervals with no data reflect too little or no CaCO3 (<0.1%) are shown by the gray bars. The position of the clay couplets is denoted by the inverted triangles at top.

