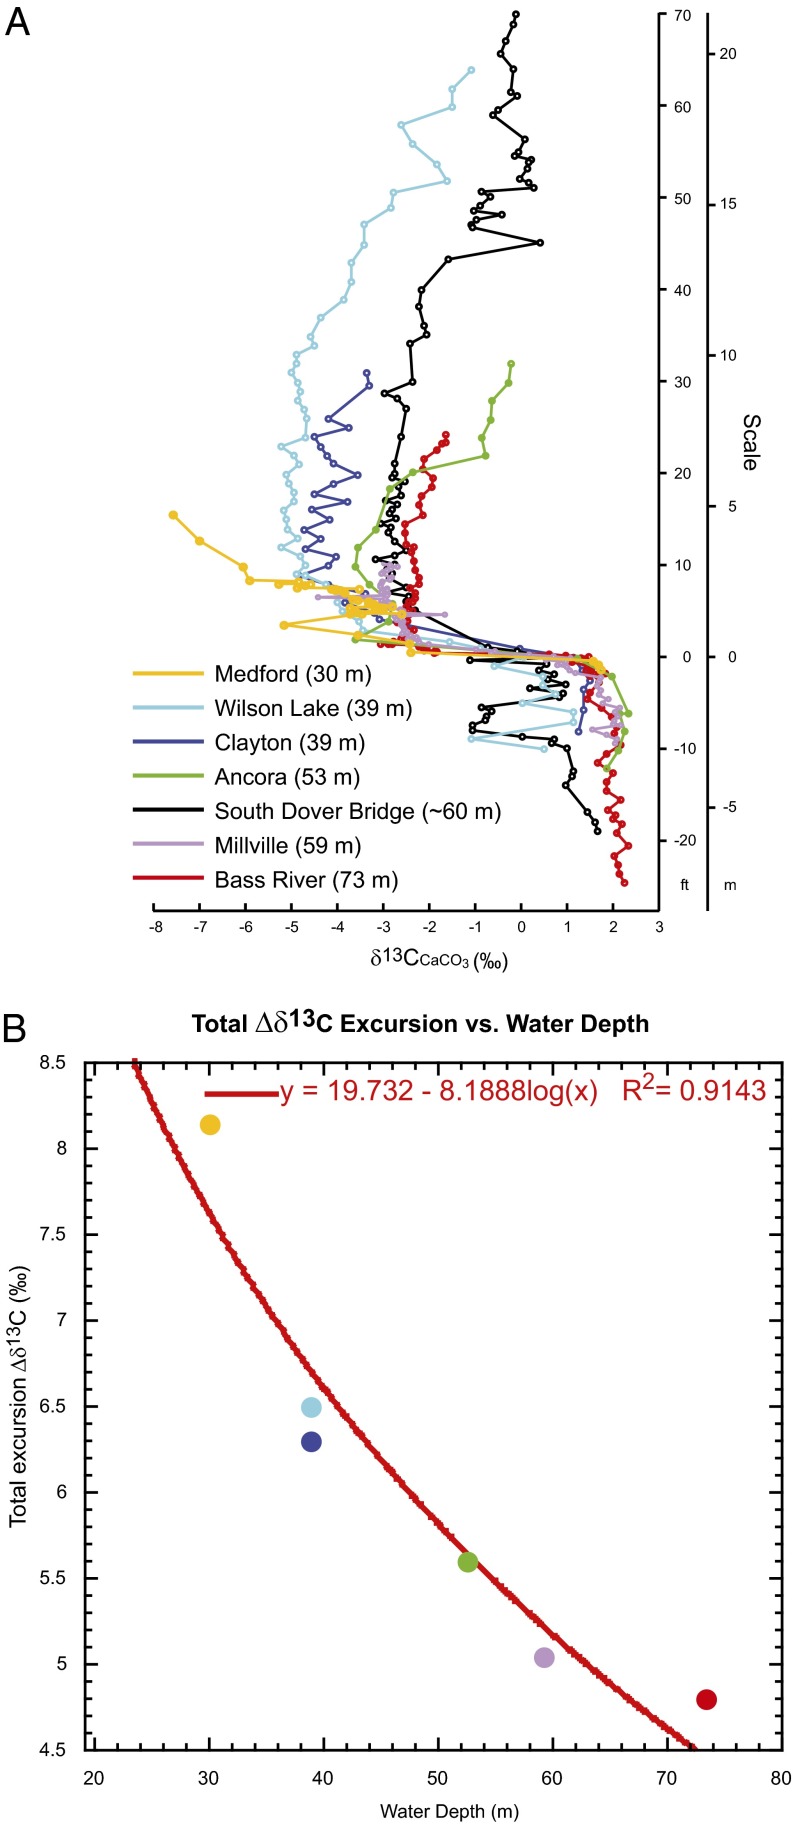
Fig. 4.
(A) Comparison of the PETM carbon isotope excursion from several sites along a dip-transect from shallow to deep on the mid-Atlantic shelf (water depths calculated using simple projection onto a dip line with a slope of 1:1,000; SI Text). From deepest to shallowest: Bass River (red) (11), Ancora (green) (11), South Dover Bridge (black) (23), Clayton (dk. blue)(11), Wilson Lake B (lt. blue), Medford (orange; SI Text). Note the deepest sites show the smallest excursions, whereas the shallowest show the largest excursions, including the Medford locality, which is based on both outcrop and core. All Marlboro Clay sections are capped by an erosional unconformity. All Marlboro Clay sections are capped by an erosional unconformity. Depths in each core are recalculated with the initiation of the CIE defined as 0 m. (B) Relationship between total carbon isotope excursion SI Text and its paleo-water depth for each site along the dip transect. A logarithmic best fit (R2 = 0.91) indicates that the very shallowest sites, those in unbuffered communication with the atmosphere, should show a total excursion of approximately −20‰ (SI Text). Data from the South Dover Bridge core not included due to large uncertainty in projection onto the dip transect.

