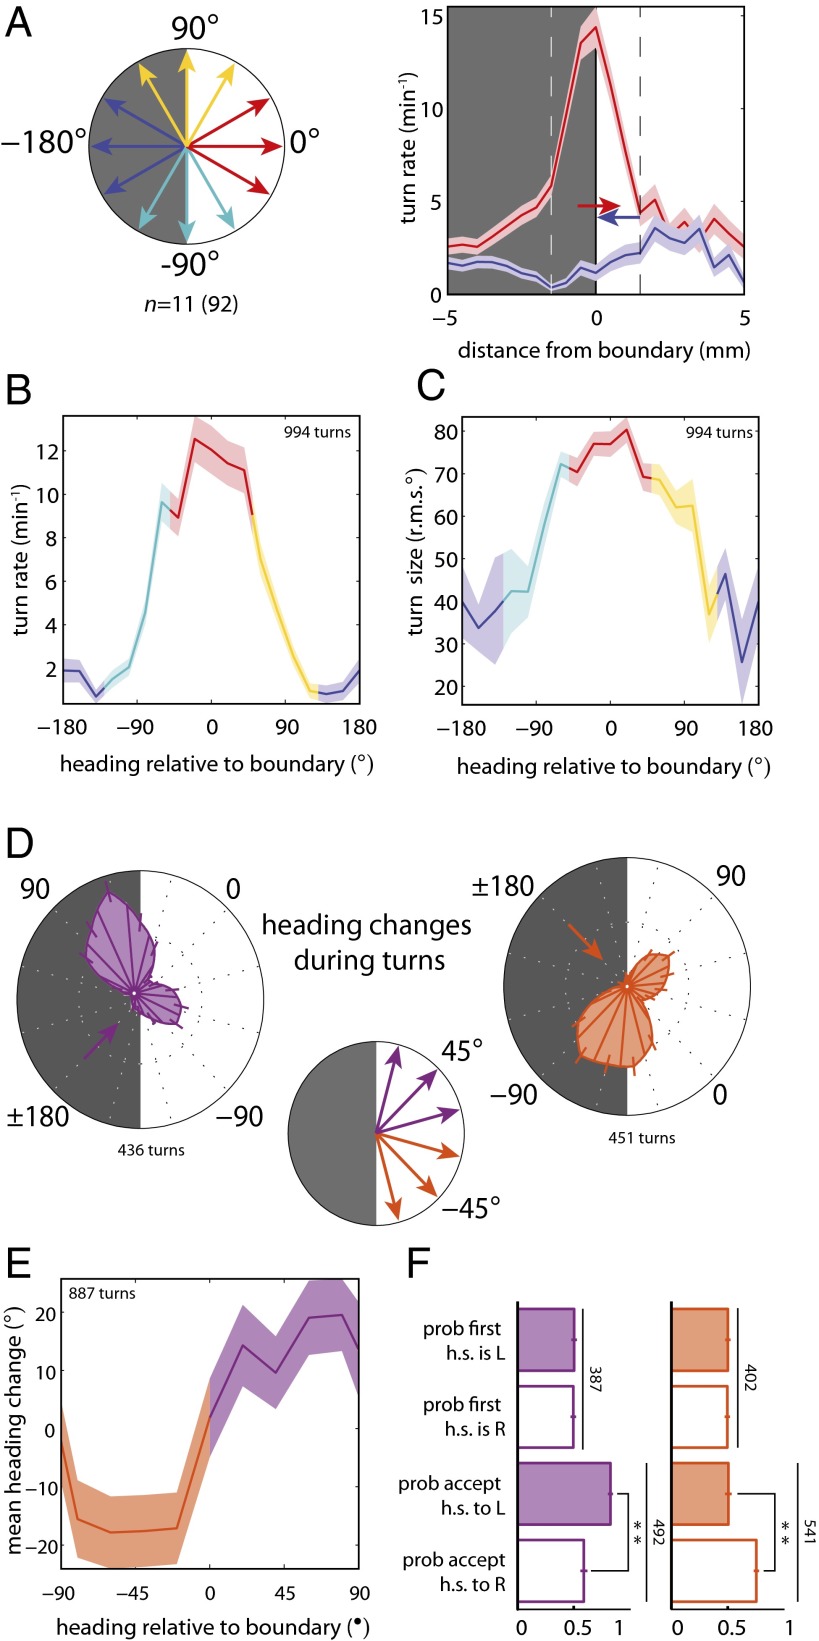
Fig. 2.
Larvae bias the frequency, size, and direction of turns to remain in the dark. n = number experiments (number larvae). For definitions of light intensities see Figs. S1 and S2. (A) Schematic of heading angles relative to boundary. Turning rate vs. distance of head from the boundary for −180° and 0° headings; dashed lines indicate boundary region. (B–F) Turns initiated when the head was in the boundary. (B) Turning rate vs. heading relative to boundary. (C) Turn size (rms degrees) vs. heading relative to boundary. (D) (Center) Schematic of heading angles diagonal to checker boundary. (Left and Right) Polar histograms of heading changes achieved by turns for a fixed initial run heading before turn. The initial heading is indicated by an arrow. (E) Mean heading change achieved by turns vs. initial heading relative to the boundary. (F) Probability of first head-sweep (h.s.) direction and acceptance to left (L) and right (R). Numbers indicate total head-sweeps. **Rejection of null hypothesis that probabilities are the same at P < 0.0001, binomial statistics.

