
Fig. 3.
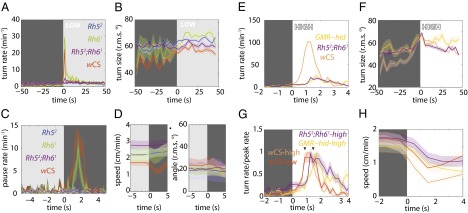
Larvae use temporal comparisons of light intensity to inform phototaxis. Shaded background represents light stimulus. Shaded areas around curves represent SEM. For definitions of light intensities, see Figs. S1 and S2. n = number experiments (number larvae). Low intensity: wCS: n = 4 (98); rh52: n = 4 (106); rh61: n = 2 (41); rh52;rh61: n = 4 (110). High intensity: wCS: n = 4 (107); GMR−hid: n = 4 (62); rh52;rh61: n = 5 (119). (A) Turn rate vs. time since light-on. (B) Turn size (rms degrees) vs. time since light-on. wCS: 2,890 turns; rh52: 2,569 turns; rh61: 927 turns; rh52;rh61: 3,258 turns. (C) Pausing rate vs. time since light-off. (D) Average speed and angle of body bend (rms degrees) vs. time since light-off. wCS: 1,299 pauses; rh52: 444 pauses; rh61: 217 pauses; rh52;rh61: 811 pauses. (E) Turn rate vs. time since light-on. (F) Turn size (rms degrees) vs. time since light-on. (G) Normalized turning rate vs. time since light-on. (H) Average speed vs. time since light-on. wCS: 3,100 turns; GMR−hid: 1,125 turns; rh52;rh61: 3,622 turns.