
Fig. 5.
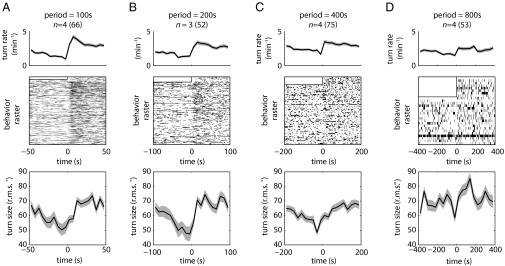
Temporal analogs of linear gradient lightscapes (triangle-wave lightscapes). Shaded areas around curves represent SEM. n = number experiments (number larvae). (A–D) Statistics of turning decisions for linear temporal gradients delivered as repeating cycles of periods equal to 100 s (A), 200 s (B), 400 s (C), and 800 s (D). (Top) Turning rate vs. time. (Middle) Raster plots represent periods in which an individual larva was turning. Each row represents one larva tracked continuously throughout the cycle. Half of the period of the first cycle was discarded to allow for acclimation. (Bottom) Mean turn size vs. time in cycle.