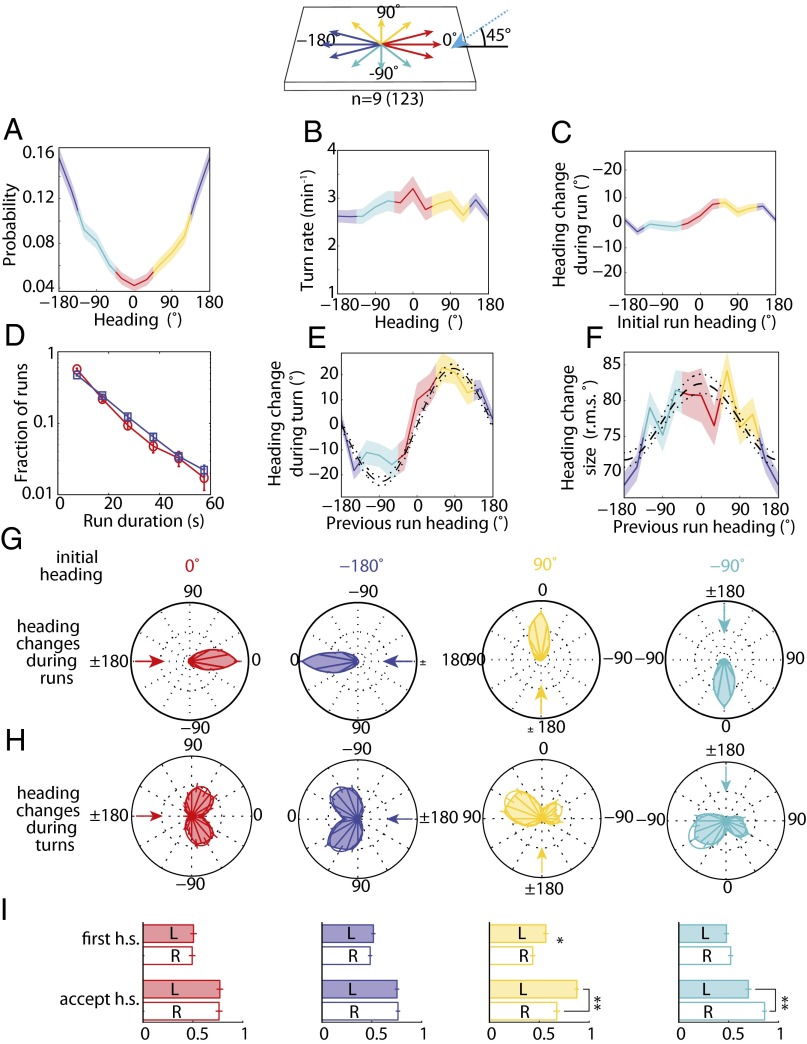
Fig. 7.
Directional lightscape navigational strategy. (Top) Schematic of headings on the directional lightscape. (A) Probability of heading during runs. (B) Turn rate vs. heading in run. (C) Mean heading change achieved in run vs. heading in initial run. (D) Distribution of run lengths for larval headings into incident light rays (red, 0°, nonpreferred heading) and away from incident light rays (blue, 180°, preferred heading). (E) Mean heading change during turn vs. previous run heading. Dashed and dotted lines are the prediction and 95% confidence interval of a model with biases in turn magnitude and head-swing acceptance (11). (F) Heading change size (rms degrees) vs. initial heading (in degrees). Dashed and dotted lines are the prediction and 95% confidence interval of the model as described in E. (G) Polar histograms of heading changes achieved by runs for afixed initial heading, indicated by arrow. (H) Polar histograms of heading changes achieved by turns for a fixed initial heading before turn. The arrow indicates the initial heading. (I) Probability of first head-sweep (h.s) direction and acceptance of head-sweeps, whether left (L) or right (R), sorted by initial heading. In A–F, shaded areas represent SEM. In I, * indicates P < 0.01 and ** indicates P < 0.0001 using binomial statistics. Data represent nine experiments and 123 animals.

