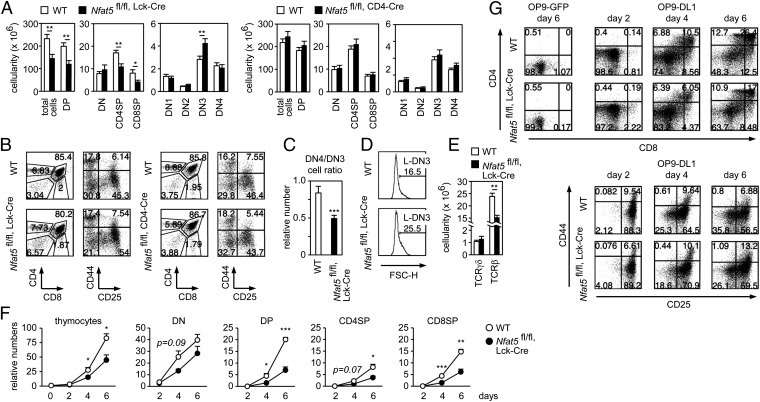
Fig. 2.
Nfat5fl/fl, Lck-Cre thymocytes have a cell-intrinsic defect in development. (A) Cell numbers for thymocyte subsets in WT, Nfat5fl/fl, Lck-Cre, and Nfat5fl/fl, CD4-Cre mice (mean ± SEM); n ≥ 6. (B) Representative flow cytometry analysis of CD4 versus CD8 in total thymocytes, and CD44 versus CD25 gated in DN cells of WT and Nfat5fl/fl, Lck-Cre mice (Left) and WT and Nfat5fl/fl, CD4-Cre mice (Right). Numbers indicate percentages. (C) Ratio of DN4 to DN3 thymocytes in WT and Nfat5fl/fl, Lck-Cre mice (mean ± SEM); n = 8. (D) Percentage of L-DN3 cells in WT and Nfat5fl/fl, Lck-Cre mice, determined by cell size (forward light scatter height parameter, FSC-H). One representative experiment is shown out of six independently performed. (E) Number of TCRγδ+ or TCRβ+ thymocytes in WT and Nfat5fl/fl, Lck-Cre mice (mean ± SEM); n ≥ 8. (F) Relative numbers of thymocyte subsets after in vitro differentiation with OP9-DL1 cells for 2, 4, and 6 d (mean ± SEM); n = 3. (G) Representative flow cytometry analysis of CD4 versus CD8 (Upper) in total thymocytes, and CD44 versus CD25 (Lower) in gated DN cells, from thymocytes cocultured with OP9 control or OP9-DL1 cells. Percentages are indicated in the quadrants. *P < 0.05; **P < 0.01; ***P < 0.001.

