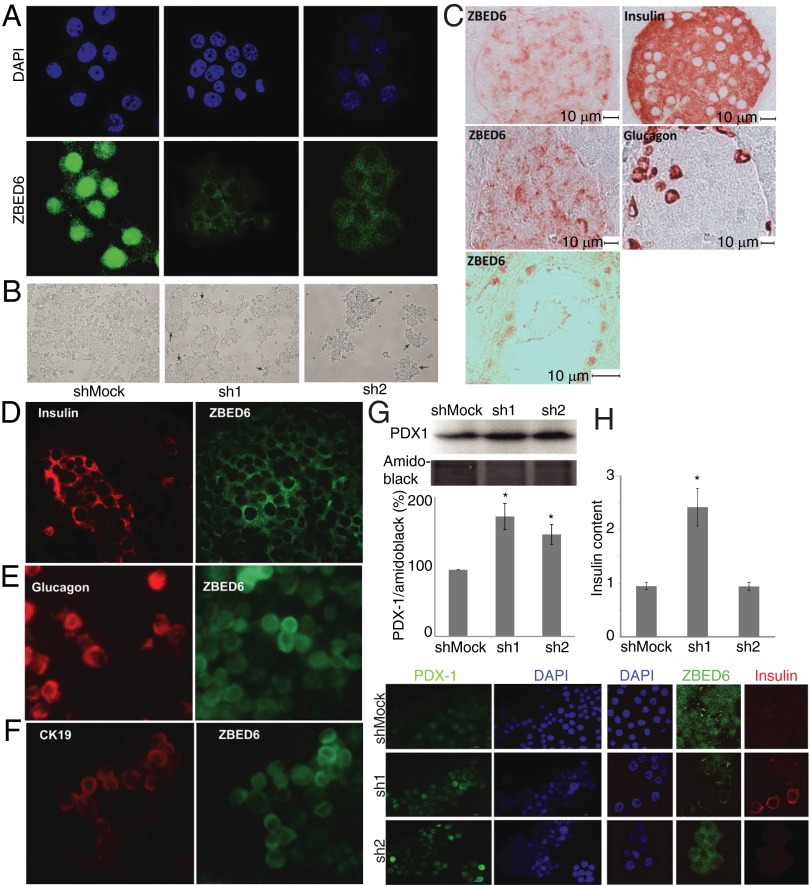
Fig. 2.
ZBED6 expression in islet cells and changes in morphology and gene expression after ZBED6 knockdown. (A) Immunofluorescence staining of βTC-6 cells with anti-mouse ZBED6 antibody (green) and DAPI (blue). ShMock, sh1, and sh2 cells were analyzed in parallel. Results are representative for three independent experiments. (B) Effects of ZBED6 knockdown on βTC-6 cell morphology. Cells were photographed in a phase contrast microscope after 3 d of in vitro culture on a standard NUNC plastic support. Pictures show low-magnification overview of cell cultures, and arrows show position of cells growing in 3D structures that resemble islets. (C) Immunohistochemical staining of 6.5-wk-old C57BL/6 mouse pancreas. Consecutive (5 μm) sections were stained for ZBED6 and insulin and for ZBED6 and glucagon (brown). The sections were briefly counterstained with hematoxylin (blue). Scale bars are given. Bottom shows a pancreatic duct stained for ZBED6. (D–F) Pairwise immunofluorescence costaining of human islet cells for ZBED6 and insulin (D), glucagon (E), and cytokeratin 19 (CK19) (F). (G and H) PDX1 and insulin expression are increased in ZBED6 silenced βTC-6 cells. (G) PDX1 levels based on five independent immunoblottings; results are means ± SEM. (Bottom) Immunofluorescence staining with PDX1 antibody and DAPI is shown. (H) Insulin contents (picograms of insulin per nanograms of DNA) based on three independent experiments; results are means ± SEM. *P < 0.05 using Student's t test. (Lower) Immunofluorescence staining with ZBED6 antibody, insulin antibody and DAPI.

