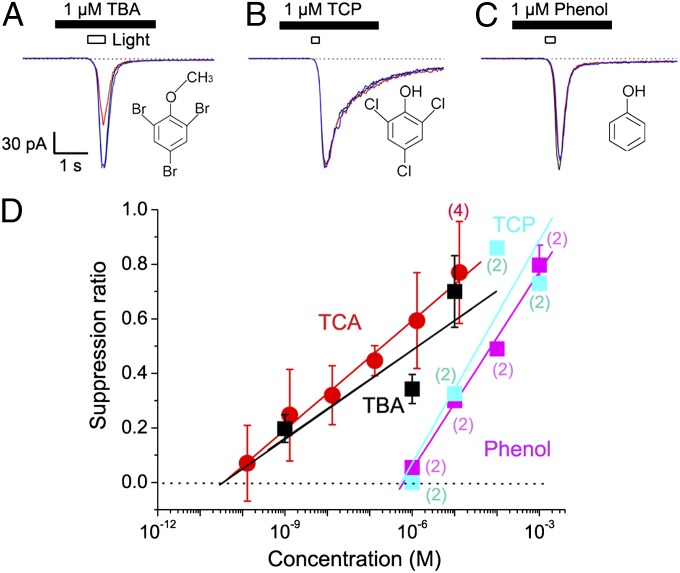
Fig. 5.
Suppression by TBA, TCP, and phenol. (A) Current suppression by 1 µM TBA (A), 1 µM TCP (B), 1 µM phenol (C), and dose-suppression relation (D). Traces: black, control; red, TBA; blue, recovery. Note that the rank order is identical to that of the human perception, TCA equivalent to TBA, which is much greater than TCP. Each plot shows the average value and SD obtained from three tested cells, except for numbers shown in parentheses. Diameter of stimulus pipette was 1 µm.

