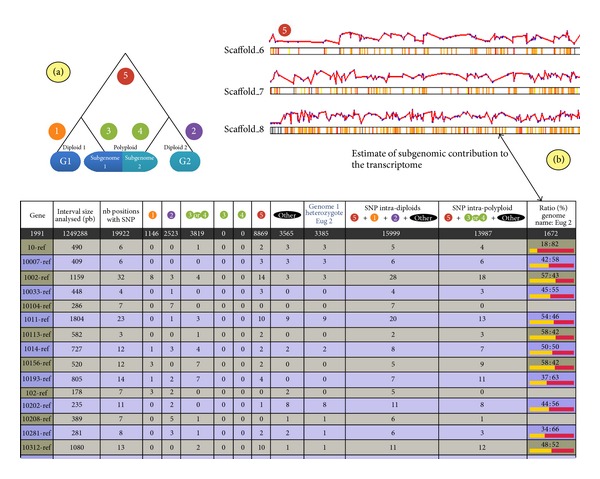
Figure 3.

SNiPloid outputs. (a) SNiPloid produces HTML outputs showing the number of predefined SNP categories and an approximate ratio of subgenome contribution to the transcriptome for each reference sequence. (b) SNiPloid is also able to generate a graphic image that shows the overall distribution of SNP categories and of subgenome contributions along the chromosomes.
