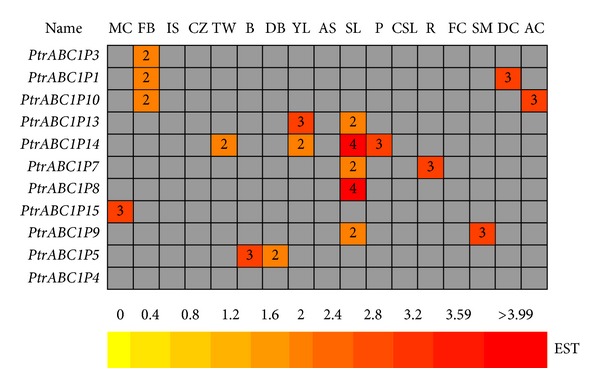
Figure 5.

In silico EST analysis of P. trichocarpa ABC1 genes. The EST frequency for each gene was calculated by evaluating its EST representation among 17 cDNA libraries available at PopGenIE (http://www.popgenie.org/) [21]. The heatmap was visualized using the Heatmapper Plus tool by counting the corresponding ESTs for each particular gene in the database. The color bar at the bottom represents the frequencies of the EST counts. MC: male catkins, FB: flower buds, IS: imbibed seeds, CZ: cambial zone, TW: tension wood, B: bark, DB: dormant buds, YL: young leaves, AS: apical shoot, SL: senescing leaves, P: petioles, CSL: cold stressed leaves, R: roots, FC: female catkins, SM: shoot meristem, DC: dormant cambium, and AC: active cambium.
