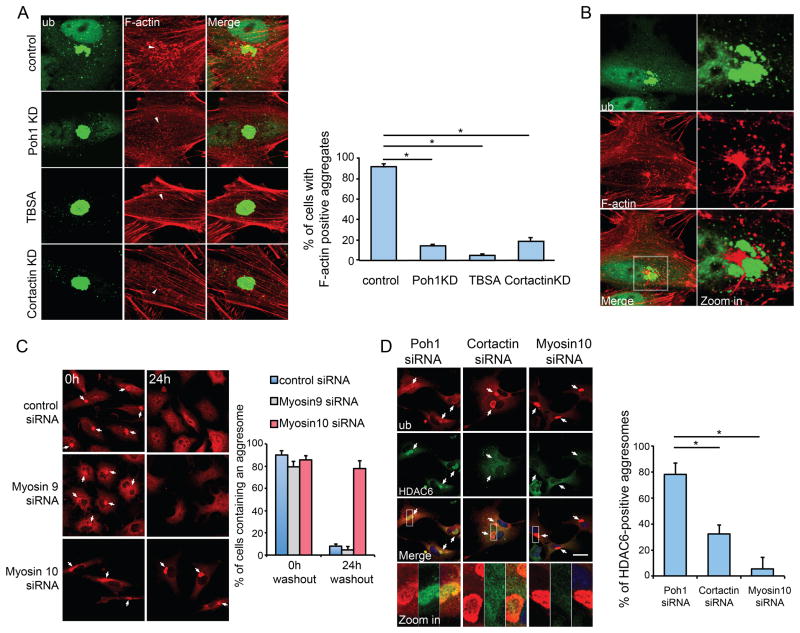
Figure 5. De-aggregation of the aggresome requires the actinomyosin system.
A549 cells were pre-treated with MG132 (5μM) for 24h to induce aggresome formation. (A) Representative images of the aggresome (ubiquitin, green) and F-actin (red, Rhodamine-Phalloidin) 12h after MG132 washout in cells with indicated treatment. In the panels of F-actin, the location of the aggresome is marked by an arrowhead. Right Panel: Cells exhibiting F-actin punctae around the aggresome were quantified from three experiments. Error bars indicate ± S.E.M. *, p < 0.01. (B) Representative staining of F-actin and a de-aggregated aggresome 12h after MG132 washout. The right panel shows the zoomed areas (white squares). (C) A549 cells transfected with the indicated siNRA were imaged 0h or 24h after MG132 washout. Aggresomes (arrows) were detected with anti-ubiquitin antibody (red) and percentage of cells retained an aggresome was quantified from three independent experiments. Error bars show S.E.M. (D) Co-staining of HDAC6 (green) and ubiquitin (red) in cells expressing indicated siRNA 24h after MG132 washout. Arrows mark aggresomes. The right panel shows the quantification of aggresomes that are positive for HDAC6 (n=3). Error bars show ± S.E.M. *, p < 0.01. See also Figure S7.

