Abstract
Objective
To survey the Society for Vascular Surgery (SVS) membership with regard to type of practice, employment status, work effort, and productivity criteria.
Methods
A survey questionnaire was developed to gather information about member demographics, academic versus private practice, employment status, time in practice, measures of work, and productivity criteria.
Results
Two-thirds of members were in private practice, 24% were employed by hospitals/health systems and 21% were in solo practice. Only 50.3% said they or their group kept record of relative value units/work relative value units (RVUs/WRVUs). Of those tracking RVUs, significantly greater number of private practice VS reported annual RVUs >10 000 compared to academic VS (P < .01). Net collections were the most common measure of productivity (51%) followed by WRVUs (36%).
Conclusions
With a changing environment and employment status of VS, tracking measures of productivity and proper benchmarking become vitally important. The SVS should consider positioning itself to collect, store, manage, and provide such information to assist members in practice transition.
Keywords: productivity, WRVU, compensation, RVU
The Society for Vascular Surgery (SVS) membership is diverse in terms of age, gender, ethnic background, employment status, type of practice, and full-time or part-time status. Recent surveys have established that almost two-thirds of SVS members are in private practice with or without teaching affiliations and are looking to the society for assistance in practice issues that concern them in particular. The SVS has as a part of its mission statement a practice development aspect which states “Provide education for vascular surgeons in new science, surgical techniques, and practice” and “Address social, economic, ethical, and legal issues related to vascular surgery.”1 It is therefore reasonable for the society to advocate for its members on issues related to the economics of vascular practice. While previous surveys of SVS members have mostly gathered demographic information, the Community Practice Advisory Committee, the Clinical Practice Council, and the Executive Committee have the need of information related to the business side of medical practice in order to adequately understand the difficulties faced by the members. The SVS could then come up with strategies to address pertinent issues.
The data and analysis presented in this article are related to work effort, productivity, compensation formulas, and how members measure and use this information. Because of the voluminous data, information related to practice trends, such as type and size of practice, work status, practice ownership, employment status, and anticipated changes in practice are described in a separate communication.
Materials and Methods
A survey questionnaire was developed to gather information about member demographics, academic versus private practice, full-time (FT) employed versus physician-owned groups, time in practice, measures of work (total relative value [RVU] and work relative value units [WRVUs]), productivity criteria, and employment status.
Through SurveyMonkey, the survey questionnaire was distributed electronically by SVS staff to 2230 members of the Society for Vascular Surgery in 2010. The survey was sent twice 1 month apart and responses were collected between February and April 2011, resulting in a 10% response rate.
The data were analyzed using SAS 9.2 software with the assistance of the Center for Clinical and Translational Science and the Center for Biostatistics at the Ohio State University Medical Center. Comparisons between specific populations were made using Pearson chi-square test or 1-sided Fisher exact test. Statistical significance was defined as P ≤ .05. Institutional review board was not required for this study.
Results
Two-thirds of respondents were in private practice. Of those in private practice, 24% were employed by hospitals/health systems. Almost half of the practitioners were in a single specialty group (48%) and 21% were in solo practice.
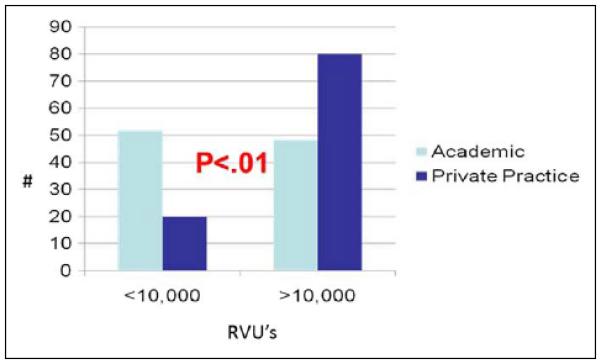
Only 50.3% (88 of 175) said they or their group kept a record of RVUs/WRVUs. Over two-thirds of respondents reported RVUs >10 000 and WRVUs >7500 annually (Table 1). The FT-employed physicians tracked RVUs more often than VS in physician-owned groups (P < .005). Of those tracking RVUs, significantly greater number of private practice VS reported annual RVUs >10 000 compared to academic VS (P < .01; Figure 1).
Table 1.
Total Relative Value Units and Work Relative Value Units Reporteda
| RVUs | % | WRVUs | % |
|---|---|---|---|
| <5000 | 1.2% | <2500 | 1% |
| 5000–9999 | 34.4% | 2500–4999 | 11% |
| 10 000–14 999 | 30% | 5000–7499 | 20% |
| >15 000 | 34.4% | 7500–9999 | 25% |
| >10 000 | 42% |
Total relative value units (RVUs, n = 61) and work relative value units (WRVUs, n = 64) reported.
Figure 1.

Work effort: total relative value units (RVUs) produced in 2010.
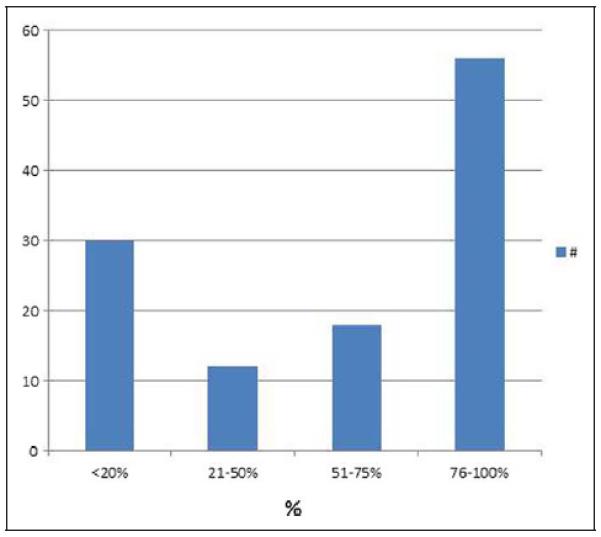
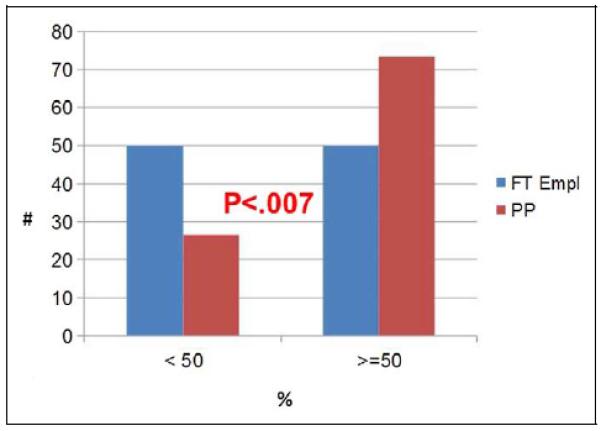
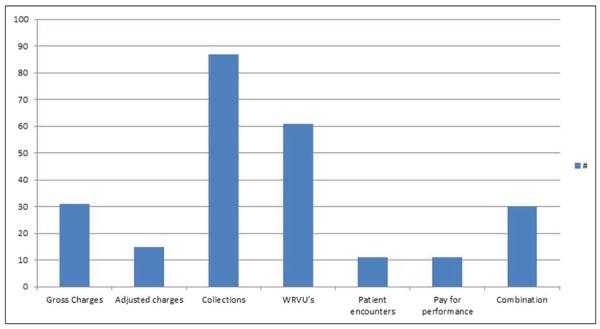
Also, 125 (69.8%) of 179 stated some of their compensation was based on productivity, with 56 (48%) of 116 stating their productivity determined 76% to 100% of their compensation (Figure 2). More physician-owned groups reported >50% of their compensation was based on productivity than FT-employed VS (P < .007; Figure 3). Net collections was the most common measure of productivity (35.3%) followed by WRVUs (24.8%; Figure 4).
Figure 2.

Percentage of compensation based on productivity.
Figure 3.

Percentage compensation based upon productivity: full-time versus private practice. FT Empl indicates full-time employed; PP, private practice.
Figure 4.

Productivity measures. WRVUs indicates work relative value units.
Discussion
Medical practice is rapidly evolving and The Patient Protection and Affordable Care Act (PPACA) may be transforming the self-employed private practice model into either consolidation with other single specialty/multispecialty groups, alignment with health systems or full-time hospital employment. Whether this trend continues or not, quality of care and cost concerns as well as the impending shortage of VS will certainly lead to fewer solo and small practices.2,3 Negotiations between VS and employer groups/hospitals will revolve, among other items, around compensation and productivity. Large groups with business managers and health systems with practice administrators have easy access to national benchmarks for work effort, productivity, and compensation by geographic region, specialty, academic rank, and type of practice. However, individual VS or small groups will be at a disadvantage as a result of either not tracking productivity measures or, if they are, failing to track the appropriate ones.
This survey is the first sponsored by the Community Practice Advisory Committee of the SVS to collect information about practice patterns, employment status, and about productivity metrics. The society can use these findings to tailor some of its educational efforts, shape the annual national meeting agenda to provide more education on business matters, direct its governmental lobbying activities, and act as a repository of practice-related data for use by SVS members.
Tracking RVUs and WRVUs
The Resource-Based Relative Value Scale (RBRVS) system to determine physician reimbursement was introduced in 1992 by Centers for Medicare and Medicaid Services (CMS) to reflect 3 components of physician services: physician work, practice expense, and professional liability insurance.4 Current Procedure Terminology (CPT) codes were developed to provide a common language to describe medical, surgical, and diagnostic procedures and services. The RBRVS required that relative value units (RVUs) be assigned to each CPT code. The RVU then becomes the basic unit of work. The American Medical Association, in cooperation with specialty societies, formed the RVU Update Committee (RUC), which then makes its annual recommendations to CMS. The final step is for CMS to use a scaling factor called the Medicare Conversion Factor, which converts geographically adjusted RVUs to determine the physician payment schedule.
The survey shows that barely 50% of members or their group kept track of their RVUs. This finding is supported by the fact that net collections, for which RVU tracking is not needed were the most common measure of productivity rather than RVUs. The FT-employed physicians tracked their RVUs more often than physician-owned groups likely because their employment contract with the employer (hospital) probably specified a tie in between compensation and total RVU or WRVUs.
Despite the fact that physician productivity and compensation is increasingly based upon work units, RVUs are mistakenly thought to measure productivity. The RVUs were designed to measure resource consumption or simply the volume of work or effort expended by a physician in treating patients when the RBRVS system was being designed. As an example, if a VS is paid $250 000 and his or her WRVUs are calculated as 5000, it means that each WRVU consumed $50 of available resources. Since the total RVUs also consist of practice expense and malpractice expense, none of which are directly affected by physician work, it is uncommonly used as the metric for assessing “productivity.” In general, WRVUs constitute approximately 53% of the total RVU and measures the work effort performed by the physician. Seventy percent of the WRVU is for time and 30% for the effort and risk.5 Lacking other objective criteria, WRVUs are therefore the metric increasingly utilized as a “productivity” measure for total compensation or a bonus incentive in employment contracts.
The greater the complexity and difficulty of the procedure, the greater the WRVU. The advantage of using WRVUs compared to other metrics is that they are standardized and not influenced by payer mix, specialty, location, or variation in charges or collection efficiencies. Comparisons between individuals and groups may however suffer due to inaccurate coding or not coding for services at all. In addition, using the RVU or WRVU productivity method to pay physicians involves some degree of uncertainty since the RUC, which updates payment, has to maintain budget neutrality.
Compensation Formulas
A compensation plan is a “method of allocating revenues and expenses in a medical practice and determining payment to the practice's physicians for their services.”6 Simply copying another formula and applying it to a practice without regard to the philosophy and culture of the physicians or the health system is a recipe for failure. When formulating a plan, the group should ask: will the plan be in alignment with the strategic plan, what incentives and what proportion will the plan put into place that allow behavior and performance compatible with this alignment, and exactly how should the physician be compensated for their work? In a health system, another consideration is at what level will compensation evaluation take place? Will it be at the specialty division, department, faculty plan, or a combination? Finally, what formula will be used for determining compensation?
Production-based formulas have become the most common method of physician compensation. In 2007, the Medical Group Management Association (MGMA) reported that 16% of group practices used RVUs (or WRVUs) to calculate physician compensation and productivity and furthermore that 34% of physicians had their compensation/productivity based on RVUs.7 In a similar report in 2010, 35% of group practices were using RVU compensation/productivity formulas and twice as many physicians as in the previous survey (61%) were compensated based upon RVU “production.”7
Almost 70% of VS surveyed stated that productivity metrics were a part of their compensation plan. Furthermore, 48% stated that these productivity metrics determined between 76% and 100% of their compensation and only 25% indicated that productivity accounted for less than 20% of their compensation formula or plan.
That this reflects the marketplace is confirmed by a 2011 survey by Merritt Hawkins, which showed that a salary plus a production bonus was the type of compensation formula offered to physician candidates in 74% of the physician search assignments.8 In addition, in half of the searches this formula was based upon RVUs (or WRVUs) and not based upon revenue generated, quality of care, volume of patients, or any cost-effectiveness metric.
However, one of the unintended consequences of this approach is that incentives may result in much greater proportion of compensation to the highest paid VS, causing an imbalance in groups. The reason being that variable costs rise with an increase in volume and if WRVUs are used as a productivity measure, the more work the VS does the lower is the cost per unit of work.9 In other words, compensation per WRVU declines. Therefore, compensation can be tied to overall productivity just not to per unit of production.
Other Measures of Productivity
Many other measures of productivity exist including patient encounters, gross charges, adjusted charges, net collections, and pay for performance (P4P). The present survey shows that net collections continue to be the most common metric used by physician groups (35.3%) followed by WRVUs (24.8%), gross charges (12.6%), a combination of measures (12.2%) and finally patient encounters and pay for performance (4.4%) each (Figure 4). More physician-owned groups compared to FT-employed VS reported >50% of their compensation was based on productivity (P < .007).
Patient encounters are easy to measure but may encourage physicians to see patients requiring short visits to boost their count and do not reflect actual collections. Gross charges are also easy to ascertain but do not reflect contractual adjustments or collections and they do not allow comparison of physician output. Adjusted charges do allow for contractual adjustments and are easy to produce but are based on uncollected charges and since payer mix can vary between physicians in the same group does not allow easy comparison with other physicians. Net collections do reflect actual collections but are heavily influenced by payer mix and may discourage physicians from providing service to uninsured or poorly insured patients. Pay for performance does reward disease management depending upon the exact plan. However, P4P currently only affects a minute portion of physician compensation and is still controversial due to the measures not being completely validated. In addition, the physician is penalized for patient noncompliance. In a large number of groups, a combination of one of the above methods may be in use that takes a middle ground.
Some practices add extra compensation for leadership positions, administrative functions, travel to outlying locations by either a flat amount or assigning WRVUs to such activities.
Benchmarks and Their Flaws
First, the practice must identify a benchmark that mirrors the type of practice being analyzed. The Faculty Practice Solutions Center (FPSC) is a consortium of the University Health System Consortium and American Association of Medical College (AAMC)10 to jointly conduct surveys of academic institutions, whereas the American Medical Group Association (AMGA) survey respondents are 93% nonacademic practices.11 Second, one must understand the type of data and the group being surveyed. Finally, the practice must prospectively configure their billing software to collect data that mirrors the benchmark. Once the comparative data are available, a “gap” analysis is performed to look at the opportunities for improving efficiencies.6
Academic practices benchmarking their work effort and productivity face another obstacle in making an “apple-to-apple” comparison. Faculty now is expected to produce as much revenue as private practitioners depending on the proportion of time they are devoting to clinical activities. The academic practice comparing itself to other academic practices or private practices has to assign the clinical full-time equivalent (CFTE) level to each clinical faculty member. So, if a faculty member is 0.67% CFTE (two-thirds time devoted to clinical activities) then comparison to a private practitioner (at 1.0 FTE) has to be appropriately adjusted for proper comparison. Our survey showed a larger proportion of private practitioners with WRVUs >10 000 compared to academic VS (P < .07). Part of the reason for the difference may be that a number of VS faculties may indeed be 0.67 or 0.5 CFTE, making a valid comparison difficult. The survey also showed that 42% of respondents reported >10 000 WRVUs compared to a mean of 10 007 WRVUs in the AAMC (1.0 CFTE) and 10 589 in the MGMA (standardized 1.0 CFTE) survey (Table 2).
Table 2.
Comparison of Relative Value and Work Relative Value Units of SVS Survey With Other Benchmarksa
| SVS Survey |
Benchmarks |
||||||||
|---|---|---|---|---|---|---|---|---|---|
| Total RVU | % of Respondents | SVS Survey 2011 | AAMC 1.0 CFTE | AAMC 0.67 Normalized | MGMA Standardized 100% Clinical | MGMA 67% CFTE | AMGA (All) | AMGA (Academic) | |
| RVUs | 34.40% | 5000–9999 | RVU # respondents | 80 | 16 | 10 | |||
| RVUs | 30% | 10 000–14 999 | Mean | 16 938 | 11 348.46 | 14 567 | 10 654 | ||
| RVUs | 34.40% | >15 000 | Median | 15 922 | 10 667.74 | 14 566 | 10 740 | ||
| WRVUs | 11% | 2500–4999 | WRVUs # respondents | 80 | 53 | 36 | 192 | 96 | |
| WRVUs | 20% | 5000–7499 | Mean | 10 077 | 10 589 | 8425 | 8213 | ||
| WRVUs | 25% | 7500–9999 | Median | 9503 | 6751.59 | 10 416 | 8398 | 8504 | 8910 |
| WRVUs | 42% | >10 000 | |||||||
Abbreviations: AAMC, American Association of Medical Colleges; AMGA, American Medical Group Association; CFTE, clinical full time equivalent; MGMA, Medical Group Management Association; p, percentile; RVU, relative value unit; SVS, Society for Vascular Surgery; WRVUs, work relative value units.
2011 survey of SVS members of which roughly one-third are academic; AAMC practices of which 100% are academic; column 4 normalized by dividing values by 0.67; AMGA survey of which about 7% are academic; AMGA academic practices only. AAMC Faculty Salary Survey 2011 reports based on 2010 data. MGMA 2011 Report Based on 2010 Data. AMGA data from 2011 Medical Group Compensation and Financial Survey. 2011 report based on 2010 data provided courtesy of Tom Flatt Director of Communications and Publications, American Medical Group Association.
One increasingly common benchmark used is compensation per WRVU. A fixed amount for a WRVU performed in the physician's own specialty can be benchmarked with data reported by MGMA or AMGA. This method can also be flawed as VS can be paid at different rates using this method depending on, for example, whether they are doing Medicare or cosmetic vein work.
A comparison of productivity as measured by RVUs and WRVUs against common benchmarks is shown in Table 2. While our survey only generated a range of these measures, it is reasonable to look across at the most frequent ranges reported by the membership and compare the RVUs and WRVUs with appropriate benchmarks for both VS in private and academic practice.
As an example, 42% of respondents reported WRVUs >10 000 annually. This is in concordance with the MGMA 100% clinical benchmark (10 416 median), since two-thirds of our respondents were nonacademic VS and therefore 100% clinical. If an academic VS at 0.67 CFTE was to benchmark herself or himself, the column to use would be either the MGMA 67% CFTE (8398 WRVUs) or the normalized AAMC 0.67 CFTE (6751 WRVUs) and not the AAMC 1.0 CFTE, which uses a benchmark of 9503 WRVUs. This is important to the academic VS because the higher WRVU benchmark may be unrealistic, giving administration the upper hand and only serving to put downward pressure on any pay increases and possible bonuses.
Finally, although the discussion has revolved around compensation formulas with relevance to measuring revenue, they also influence how the overhead is allocated since costs not directly attributed to an individual physician are often allocated on the basis of the same measure whether it is gross, adjusted, or net collections.
Limitation of the Study
The low response rate is of concern although the SVS staff observes that this is within range of the surveys sent out by the society. In addition, the number of responses in major benchmarks for RVUs (10–80) and WRVUs (36–192) relies on similar numbers (Table 2). It is also possible that more than one VS responding from within a large group may have skewed the results.
Conclusion
In conclusion, with a changing environment and employment status of VS, tracking measures of productivity (and therefore compensation) and proper benchmarking become vitally important for employment negotiations. Since most data in currently used benchmarks are proprietary, expensive, and based upon a small number of VS, the SVS should consider positioning itself to collect, store, manage, and provide such information to assist members in practice transition. The SVS is in an ideal position for maintaining a database, which can be accessed by members to benchmark their productivity with similar groups and to spot discrepancies between a database that they trust and the health system-supplied information. Annual surveys should be further refined and conducted by the SVS and the accuracy strengthened by asking business managers of VS practices to participate in the surveys. Trends should be shared with the membership at the annual vascular meeting or special meetings focused on compensation and productivity.
Acknowledgment
The authors wish to thank all previous (2010–2011) members as well as current members of the Community Practice Advisory Committee for their encouragement and support of this project. The current members are Dennis Gable, Chair, Ronald Bays, Bruce Brener, Paul Collins, Luis Echeverri, Patricia Furey, Krishna Jain, Kara Kvilekval, John Maowad, Stephen Motew, Robert Oram, Geoffrey Risley, Russell Samson, Bhagwan Satiani, Robert Singh, Michael Verta, Victor Weiss, and Robert Winter. The authors would also like to acknowledge the assistance of Emily Kalata SVS staff and Liaison of the committee and Ruth Bush Chairperson of the Clinical Practice Council of the Society for Vascular Surgery for assistance in conducting and compiling the results of the survey and Mahmoud Abdel-Rasoul at The Ohio State University for performing the statistical analysis.
Funding The author(s) received no financial support for the research, authorship, and/or publication of this article.
Footnotes
Declaration of Conflicting Interests The author(s) declared no potential conflicts of interest with respect to the research, authorship, and/or publication of this article.
References
- 1. [Accessed March 26, 2012];Society for Vascular Surgery. www.vascularweb.con.
- 2.Satiani B, Williams TE, Go M. Predicted shortage of vascular surgeons in the United States: population and workload analysis. J Vasc Surg. 2009;50(4):946–952. doi: 10.1016/j.jvs.2009.06.056. [DOI] [PubMed] [Google Scholar]
- 3.Satiani B, Vaccaro PS. A critical appraisal of physician-hospital integration models. J Vasc Surg. 2010;51(4):1046–1053. doi: 10.1016/j.jvs.2009.11.035. [DOI] [PubMed] [Google Scholar]
- 4.Hsiao WC, Braun P, Becker E, et al. A national study of resource-based relative value scales for physician services: final report. Department of Health Policy and Management, Harvard School of Public Health, and Department of Psychology, Harvard University; Cambridge, Mass: 1988. 1 and 2 (Supplemental Report and Phase II Final Report) [Google Scholar]
- 5.Satiani B. The resource based relative value scale, Medicare Physician fee schedule, and other payment mechanisms. In: Satiani B, editor. The Smarter Physician. Vol 2. Conquering your practice's billing and reimbursement. Medical Group Management Association; Englewood, Colorado: 2007. [Google Scholar]
- 6.Johnson BA, Keegan DW. Physician Compensation Plans. Medical Group Management Association; Englewood, Colorado: 2006. [Google Scholar]
- 7.RVU based Physician compensation and productivity. Medical Group Management Association; [Accessed March 26, 2012]. http://www.merritthawkins.com/pdf/mhaRVUword.pdf. [Google Scholar]
- 8.2011 Review of Physician Recruiting Incentives. [Accessed March 26, 2012];Merritt Hawkins. http://www.merritthawkins.com/uploadedfiles/mha2011incentivesurveypreview.pdf.
- 9.Litzau D. Be careful what you reward in production-based physician compensation plans. [Accessed July 14, 2009];MGMA e-Source. http://www.mgma.com/article.aspx?id=29568.
- 10.Faculty Practice Solutions Center (FPSC) [Accessed March 26, 2012]; https://www.facultypractice.org/AFS.htm.
- 11.American Medical Group Association [Accessed March 26, 2012]; http://www.amga.org/.


