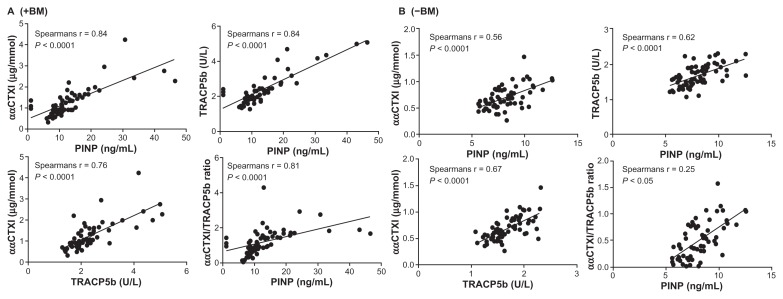
Figure 3.
Correlations between ααCTX-I and PINP; ααCTX-I and TRAC5b; TRACP5b and PINP; ααCTX-I/TRACP5b ratio and PINP in patients +BM (A) and −BM (B). A significant correlation was observed for all cases. A Spearman Rho correlation (Spearman r) is stated for each correlation in the respective figures.
Note: ***P < 0.0001 indicated highly significant elevated levels for Soloway score 1,2,3,4 compared to score 0.

