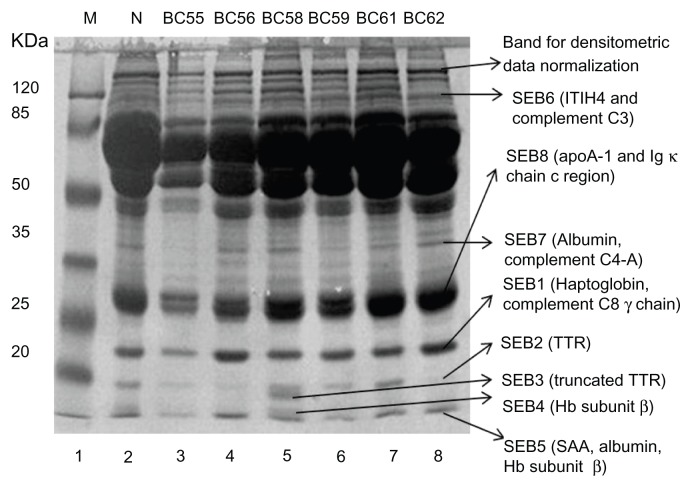
Figure 2.
Comparison of protein expression profiles in the sera of different types of breast carcinoma and fibroadenoma.
Notes: Sera of patients and normal individuals were subjected to SDS PAGE as described in materials and methods. Variations in protein bands were examined after Coomassie brilliant blue staining.
Abbreviations: M, Molecular weight markers; N, Normal individual; BC55, Phylloid tumor; BC56, Infiltrating ductal carcinoma; BC58, Fibroadenoma; BC59, Duct carcinoma; BC61, Lobular carcinoma; BC62, Infiltrating ductal carcinoma; BC55, BC58, Benign breast diseases patients; BC56, BC59, BC61, and BC62, Breast cancer patients.

