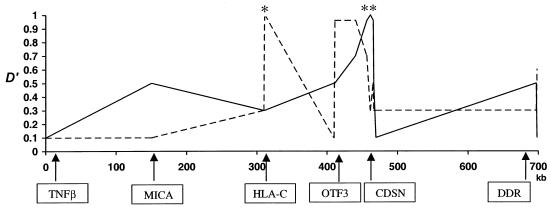
Figure 2.
Patterns of LD conservation, as measured by analysis of 15 SNPs spanning 700 kb, at the boundary between MHC class I and class III loci. D′ decay from HLA-C SNP 290 (dashed line) and from CDSN1243 (continuous line) is plotted against distance and location of analyzed genes. The asterisk (*) and double asterisk (**) symbols denote the positions of HLA-C SNP 290 and of CDSN1243, respectively.

