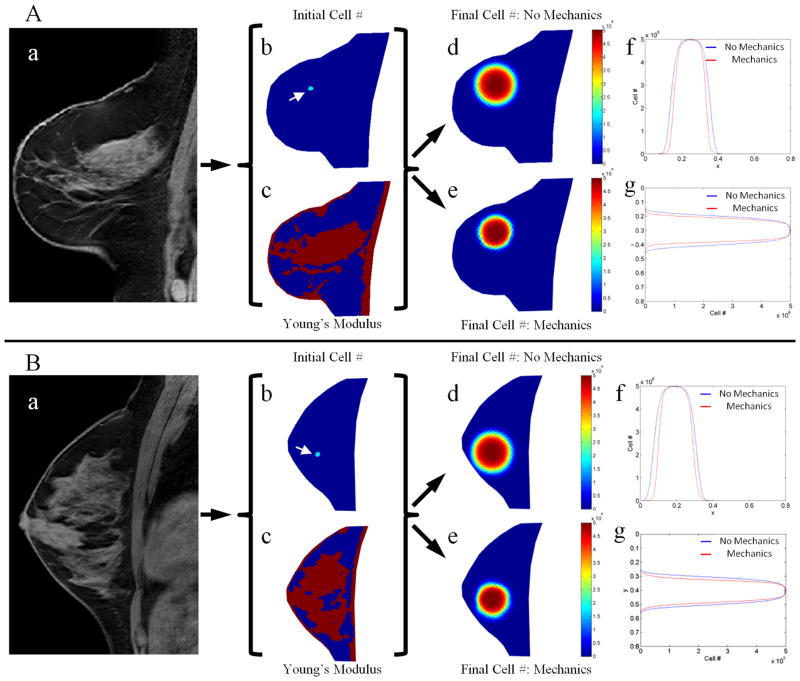
Figure 2.
Simulations of tumor growth with and without mechanical coupling for two different healthy subjects (Panels A and B). Tumor growth was simulated by using a T1 image (a) to seed a tumor at the initial time point (b, white arrows), generating a Young’s modulus map (c) by segmenting adipose (blue voxels) and fibroglandular tissue (red voxels), assuming growth parameters, and then projecting the model forward in time to a final time point either using a model without mechanical coupling (d) or with mechanical coupling (e). Horizontal (f) and vertical (g) line profiles through the center of the simulated tumor shows the spatial distribution of tumor cell number for both models, highlighting areas of restricted cell diffusion in the mechanics coupled model in areas of higher tissue elasticity.

