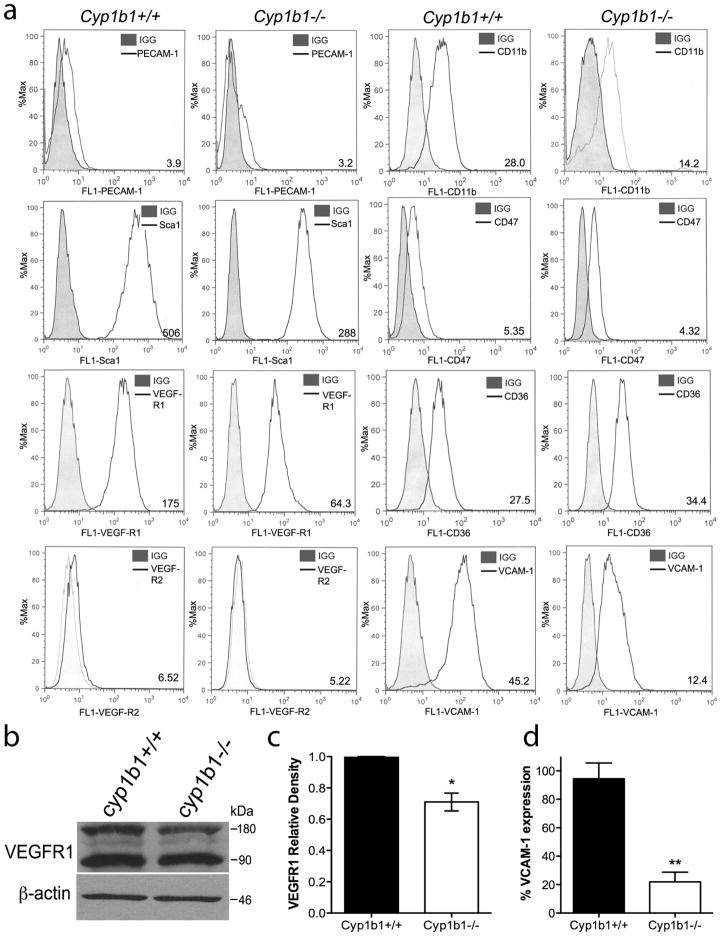
Figure 2.
Retinal PC express other vascular cell markers. (a) Expression of PECAM-1, Sca1, VEGF-R1, VEGF-R2, CD11b, CD36, CD47, and VCAM-1 were determined by flow cytometry. Representative mean fluorescent intensities are indicated in bottom right corner of each panel. Shaded areas show staining in the absence of primary antibody. (b) Expression of VEGF-R1 was analyzed by western blot. A representative image is shown. (c) Mean relative density for VEGF-R1 was determined (n=2, *P<0.05). (d) Percent expression of VCAM-1 was determined by flow cytometry (N=3, **P<0.01).

