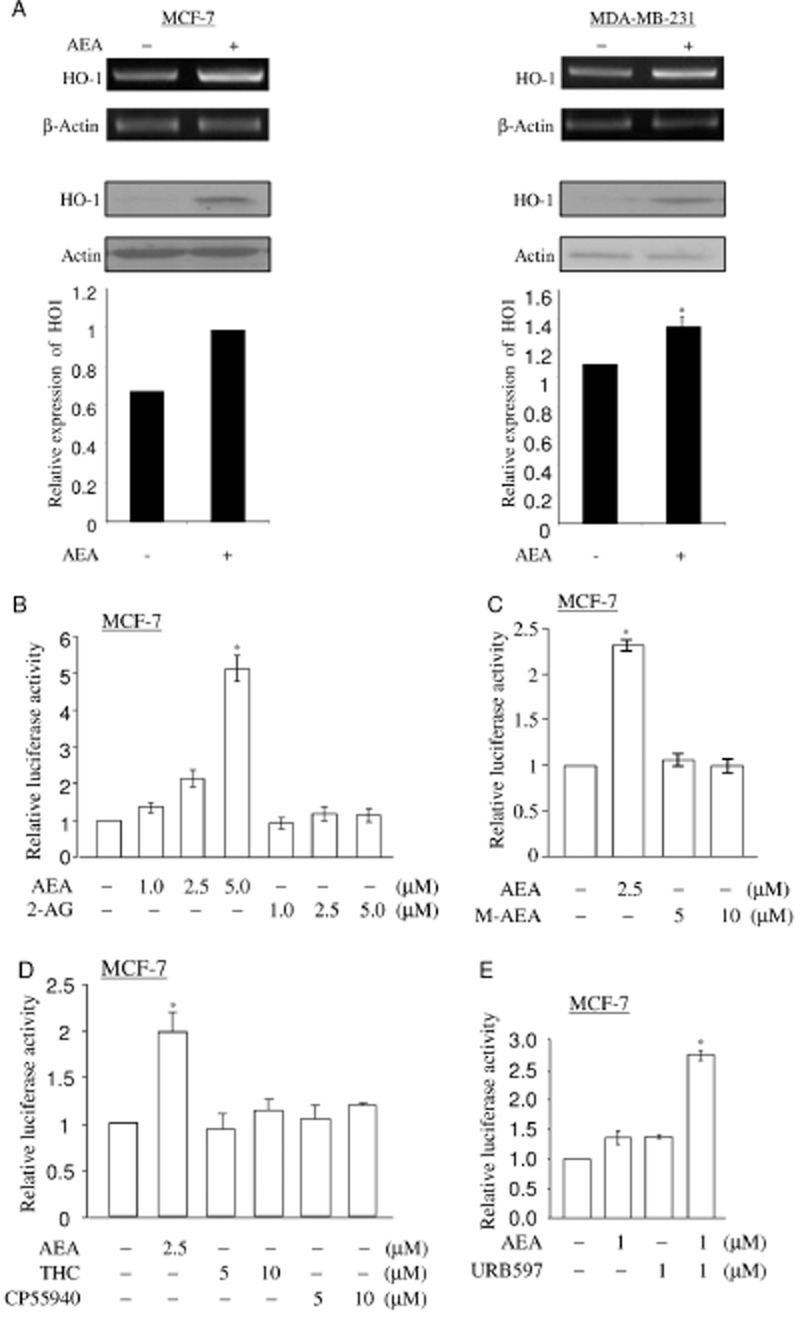
Figure 2.

AEA induces HO-1 transcription. (A) AEA induces HO-1 expression. MCF-7 cells and MDA-MB-231 cells were treated with 2.5 μM of AEA for 6 h. The mRNA levels of HO-1 were determined by semi-quantitative RT-PCR as in Figure 1A. Total lysates of MCF-7 cells or MDA-MB-231 cells treated with vehicle (DMSO) and AEA (2.5 μM) for 16 h were applied to detect the levels of HO-1 protein. The levels of HO-1 expression were normalized to actin expression and the relative expression was represented graphically. All figures are representative of three independent experiments. (B) AEA, but not 2-AG, activates nqo1-ARE-Luc reporter in a dose-dependent manner. MCF-7 cells co-transfected with reporter (0.5 μg) and pCMV-β-galactosidase (0.15 μg) were treated with increasing doses (1, 2.5 and 5.0 μM) of AEA or 2-AG for 16 h. Luciferase activity assay and data analysis were performed as in Figure 1C. The data represent the mean ± SD of at least three independent experiments performed in triplicate. (C) R(+)-Methanandamide fails to activate nqo1-ARE-Luc reporter. MCF-7 cells co-transfected with reporter (0.5 μg) and pCMV-β-galactosidase (0.15 μg) were treated with increasing doses (5 and 10 μM) of R(+)-methanandamide and 2.5 μM of AEA for 16 h. Luciferase activity assay and data analysis were performed as in Figure 1C. The data represent the mean ± SD of at least three independent experiments performed in triplicate. M-AEA: R(+)-Methanandamide. (D) THC and CP55940 fail to activate nqo1-ARE-Luc reporter. MCF-7 cells co-transfected with reporter (0.5 μg) and pCMV-β-galactosidase (0.15 μg) were treated with increasing doses (5 and 10 μM) of THC and CP55940 and 2.5 μM of AEA for 16 h. Luciferase activity assay and data analysis were performed as shown in Figure 1C. The data represent the mean ± SD of at least three independent experiments performed in triplicate. (E) AEA-mediated nqo1-ARE-Luc reporter activation is augmented by URB597. MCF-7 cells transfected with nqo1-ARE-Luc reporter (0.5 μg) and pCMV-β-galactosidase (0.15 μg) were pretreated with 1 μM of URB597, followed by 1 μM of AEA treatment for 16 h. Luciferase activity assay and data analysis were performed as in Figure 1C. The data represent the mean ± SD of at least three independent experiments performed in triplicate. *P < 0.05 as compared with the control untreated cells.
