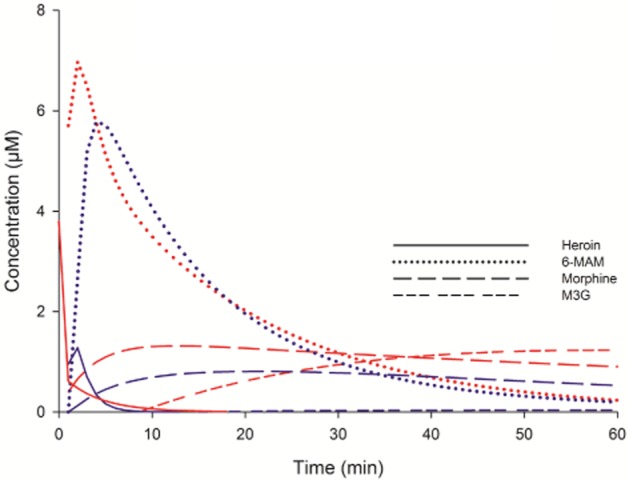
Figure 3.

Blood and brain ECF concentrations of heroin, 6-MAM, morphine and M3G after i.v. administration of 3 μmol (1.3 mg) heroin. Lines show the fitted values calculated in Kinetica software. Red lines: fitted blood values time 0–60 min (n = 8, M3G n = 7). Blue lines: fitted brain ECF values from time 0 to 60 min (n = 7, M3G n = 6).
