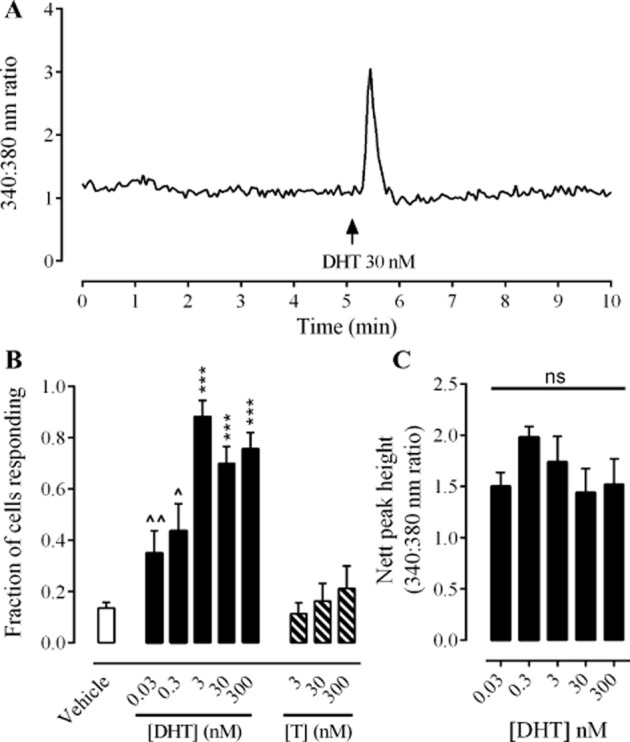
Figure 1.

Acute effects of DHT and testosterone on [Ca2+]i in HCPSC. Panel A shows an example trace from a cell exhibiting a transient elevation of [Ca2+]i in response to DHT. Panel B shows the fraction of cells (mean ± SEM) responding to vehicle ( ), DHT (0.03–300 nM;
  ) and testosterone (T, 3–300 nM;
  ). Data sets were analysed by one-way anova, Dunnett's post test, n = 80–200 cells from four to eight experimental replicates. *** denotes P < 0.001 when compared with vehicle control. ∧ and ∧∧ denote P < 0.05 and 0.01, respectively, when compared with 3 nM DHT. Panel C shows the magnitude of responses to DHT (0.03−300 nM) as measured by peak height above baseline (340:380 nm ratio). Data sets were analysed by one-way anova, Bonferroni's post test, n = 80–200 cells from four to eight experimental replicates.
