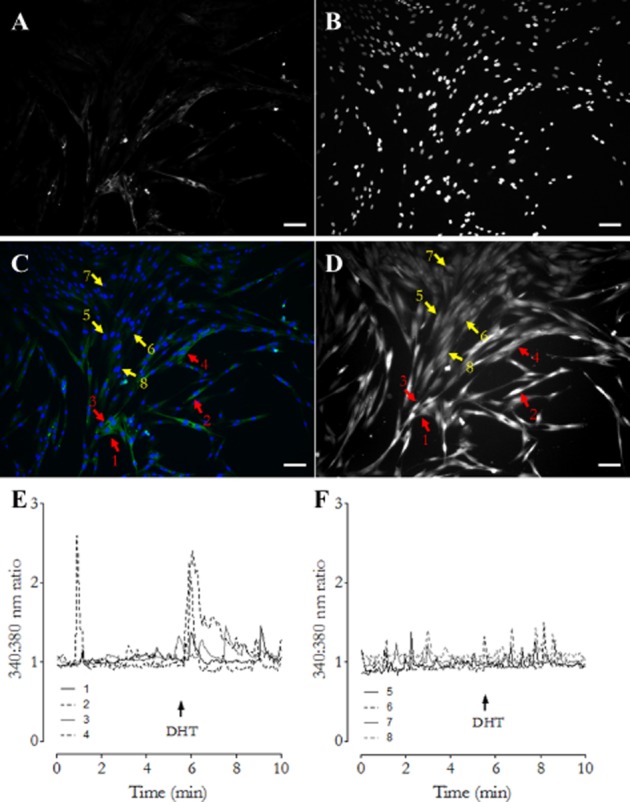
Figure 2.

Identification of cells responsive to DHT. Following imaging experiments, cells were fixed and labelled for SMA (A) and cell nuclei counter stained with DAPI (B). Panel C shows a composite image of SMA (green) and DAPI (blue) labelling. Panel D shows the same field of view from calcium-imaging experiments where cells were loaded with the calcium fluorophore FURA-2AM. Arrows 1–4 (red) highlight SMA-positive cells. Arrows 5–8 (yellow) highlight SMA-negative cells. Panel E shows the calcium-imaging trace generated by cells 1–4 (SMA positive). Panel F shows the trace generated by cells 5–8 (SMA negative). In all image panels, scale bars represent 100 μm.
