
Figure 6.
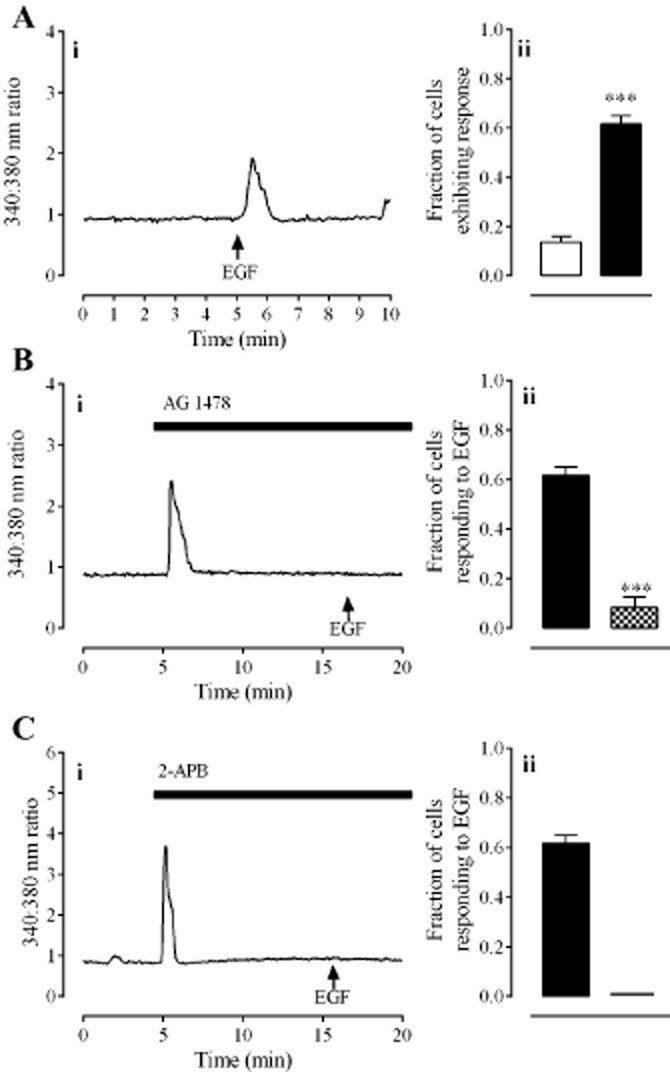
The effect of EGF on [Ca2+]i in HCPSC. Panel A shows responses to EGF (100 ng·mL−1). Panel B shows the effect of AG 1478 (30 nM) on responses to EGF. Panel C shows the effect of 2-APB (50 μM) on responses to EGF. In all panels, left hand graphs (i) show typical traces each from one cell. Right hand graphs (ii) show the fraction of cells (mean ± SEM) responding to vehicle ( ), EGF alone (
 ) or EGF in the presence of antagonists (
 ). *** denotes P < 0.001 when compared with DHT only (unpaired t-test, n = 80–120 cells from four individuals).