
Figure 7.
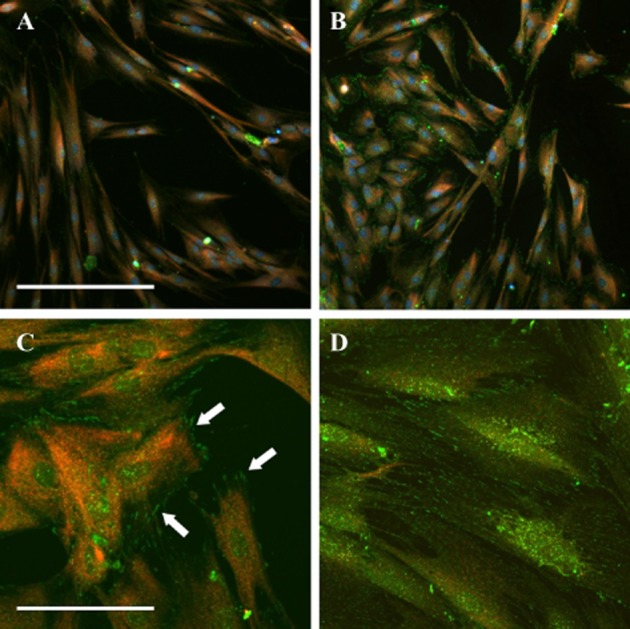
Analysis of EGFR phosphorylation. Cells were fixed within 3 min of addition of vehicle (A), DHT (B, C: 30 nM) or EGF (D: 100 ng·mL−1) and labelled with antibodies against the EGFR (red) and phosphorylated EGFR (green). Images were taken at 20× (A, B) or 60× (C, D) magnification. Arrows highlight phosphorylated EGFR. Scale bars represent 350 μm (A, B) and 50 μm (C, D).