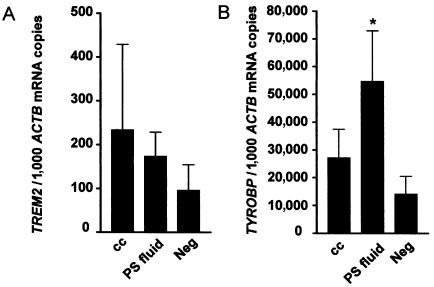
Figure 4.
Quantitative RT-PCR analysis of the expression of TREM2 (A) and TYROBP (B). Monocytes were stimulated with either a cytokine combination (comprising M-CSF, RANKL, and IL-1β) (cc) or pseudosynovial (PS) fluid, for 24 h, along the osteoclastic lineage. Human monocytes from healthy individuals were isolated from buffy-coat cells over Ficoll-Paque (Amersham Pharmacia Biotech). Mononuclear cells were collected, washed with PBS, and resuspended in serum-free macrophage medium (GIBCO) with antibiotics. Approximately 10–15×106 cells/well were allowed to adhere to six-well plates, for 1 h at 37°C. Nonadherent cells were washed away with PBS, and mononuclear cells were stimulated, for 24 h, with either cytokines (i.e., M-CSF, RANKL, and IL-1β) or PS fluid. Stimulations were performed four times, in duplicate. Total RNA was isolated by use of TRIzol reagent, according to the manufacturer's instructions (GibcoBRL/Life Technologies). The RNA concentration was measured spectrophotometrically, and the quality was ascertained by ethidium bromide agarose gel. Three micrograms of the RNA was treated with DNase, and 2 μg of RNA was transcribed to cDNA (SuperScript Preamplification System; GibcoBRL). The number of copies of TYROBP and TREM2 in stimulated cells was determined by quantitative RT-PCR amplification from 200 ng of cDNA in LightCycler SYBR Green I PCR mix, by a LightCycler PCR machine (Roche/Molecular Biochemicals). The identity of the product was verified by melting-curve analysis. Serial dilutions of human TREM2 cDNA (GenBank accession number BF343916) and of TYROBP cDNA (GenBank accession number AA481924), cloned in a plasmid vector, were used to determine the copy number of the amplicon per 1,000 copies of ACTB (β-actin) cDNA (GenBank accession number X00351). Each individual sample was amplified at least twice for both genes. Statistical analyses were performed by one-way ANOVA with Bonferroni's multiple-comparison test (GraphPad Prism, version 3.00 for Windows; GraphPad Software). The values are expressed as the mean ± SEM of copies per 1,000 ACTB mRNA. Neg = negative controls. A, Expression of TREM2, which is increased in both the cc-stimulated (234 ± 195 copies of mRNA) and PS fluid–stimulated (174 ± 55 copies of mRNA) monocytes, compared with that in the negative controls (96 ± 58 copies of mRNA). However, the difference remained statistically nonsignificant (P>.05). B, Expression of TYROBP, which also is increased in cc-stimulated (27,190 ± 10,270 copies of mRNA; P>.05) and PS fluid–stimulated (54,740 ± 18,220 copies of mRNA; P<.05, denoted by an asterisk [*]) cells, compared with that in the negative controls (14,210 ± 6,290 copies of mRNA).

