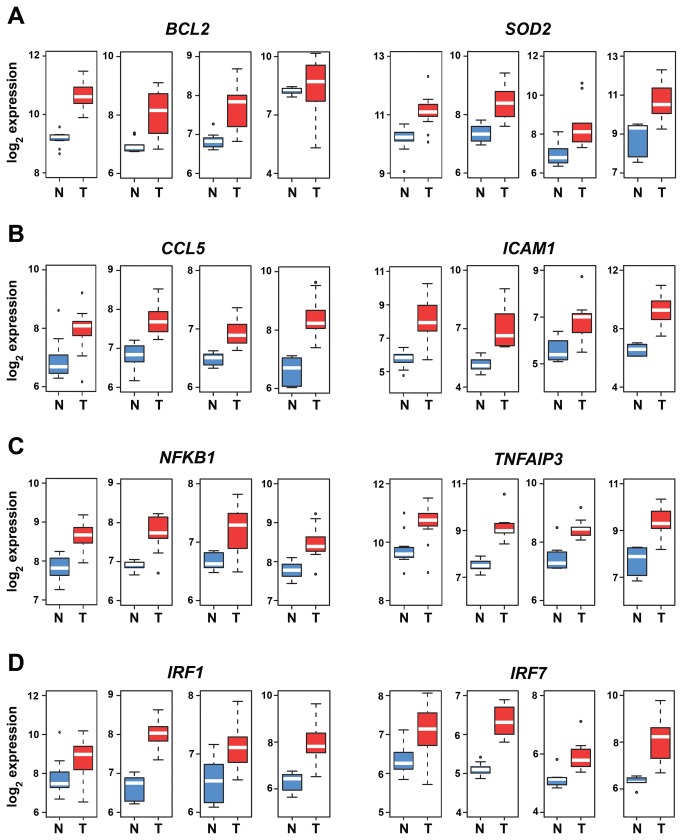
Figure 2. Box plots depicting individual mRNA expression levels of representative genes from the NF-κB signature.
(a) Cell-survival genes BCL2 and SOD2, (b) pro-inflammatory genes CCL5 and ICAM1, (c) NF-κB regulators NFKB1 and TNFAIP3 and (d) interferon regulatory factors IRF1 and IRF7. Data were normalized using RMA. Fold-changes for Tumor (T) versus Normal (N) comparison were obtained by LIMMA. Y-axis shows RMA-normalized expression level (on log2 scale) of each mRNA. Blue boxes represent gene expression levels in normal tissue, and red depicts expression in ccRCC. The white line within each box is the median, and distance between box and whiskers indicate interquartile ranges. Each of the four graphs per gene represent expression profiles in arrays generated by (from left to right) the Cifola, Gumz, Lenburg, and Yusenko studies.

