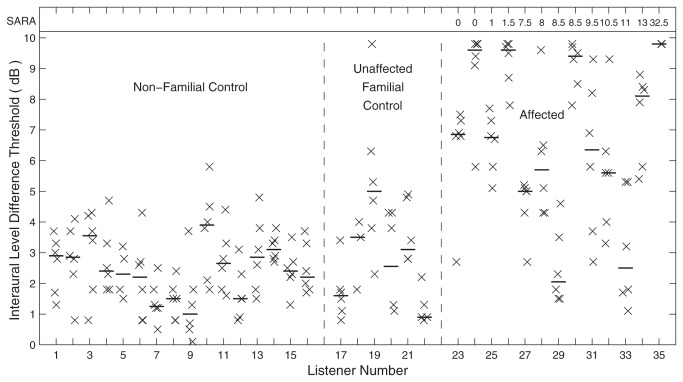
Figure 2. Interaural-level-difference (ILD) thresholds.
Each vertical column of X's represents ILD thresholds for one listener measured using a 3-down-1-up adaptive procedure. The horizontal line segment in each column indicates the median value for that listener. All other conventions are as in Figure 1.

