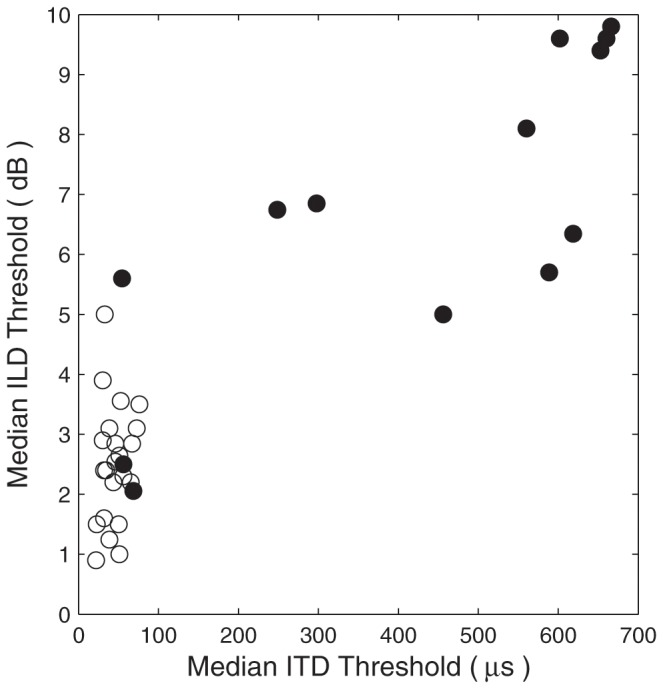
Figure 3. Relationship of ILD and ITD sensitivity.

Each symbol represents data from one listener, with median ILD thresholds and median ITD thresholds plotted in the vertical and horizontal dimensions, respectively. Open circles represent non-familial and unaffected familial control listeners, and filled symbols represent affected listeners.
