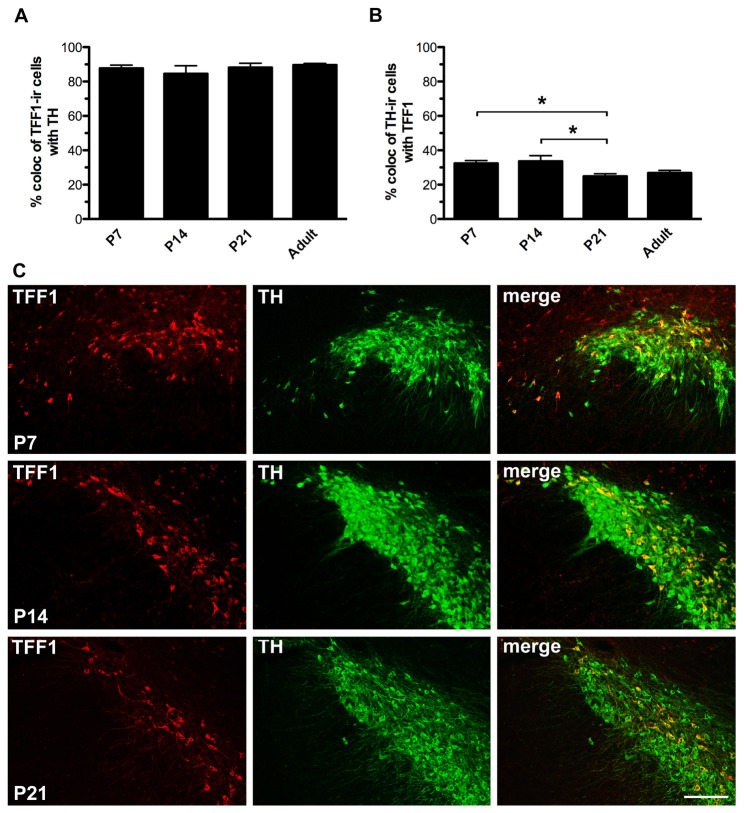
Figure 4. Quantification of trefoil factor 1 (TFF1) and tyrosine hydroxylase (TH) co-expressing cells during development.
A) Quantification of trefoil factor 1-immunoreactive (TFF1-ir) cells co-expressing tyrosine hydroxylase (TH) and B) TH-ir cells co-expressing TFF1 in the substantia nigra (SN) of postnatal (P) day 7, 14, 21 and adult rats. The percentage of TH/TFF1 co-expressing cells was significantly higher for P7 and P14 rats compared to P21 rats, whereas there was no significant difference between the percentages of TFF1-ir cells co-expressing TH. Data are expressed as mean ± SEM (*: p<0.05, n = 4-7). C) Representative double immunofluorescence images of TFF1-ir and TH-ir cells in SN of P7, P14 and P21 rats (see Figure 2 for adult rats). Scale bar: 200 µm.

