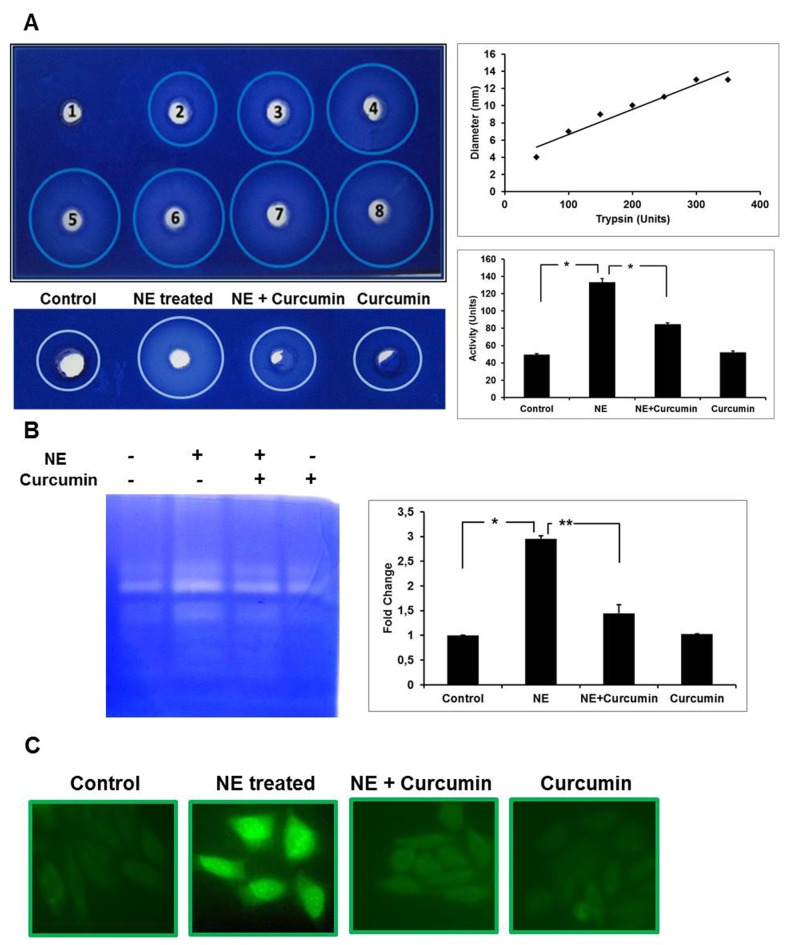
Figure 3. Effect of curumin on gelatinolytic activity.
A) Gel-diffusion assay: Upper gel: Various concentrations of trypsin (1-Blank; 2-5 µg/µl; 3-10 µg/µl; 4-15 µg/µl; 5-20 µg/µl; 6-25 µg/µl; 7-30 µg/µl; 8-35 µg/µl) were added to different wells and protease activity was observed as digested zones around it. A standard curve of the enzyme activity in units as a function of diameter of zone was prepared. The enzyme activity for different samples shown in the lower gel (Control; NE-treated; NE+Curcumin-treated; Curcumin-treated alone) was calculated from the standard graph and represented as a histogram (*P<0.01). The difference of NE-treated was significant to control as well as NE+Curcumin-treated group. B) Gelatin Zymography: Samples in different lanes of zymograms starting from the left represented as Lane-1: Control; Lane-2: NE-treated; Lane-3: NE+Curcumin-treated; Lane-4: Curcumin-treated alone. The fold change in the activity for bands corresponding to MMP-9 with respect to control was quantified using ImageJ and plotted as histogram (*P<0.01, **P<0.05). C) in-situ Gelatin Zymography: The experiment was carried out under different experimental conditions above and images captured by fluoresencent microscope at 20X magnifications are represented.

