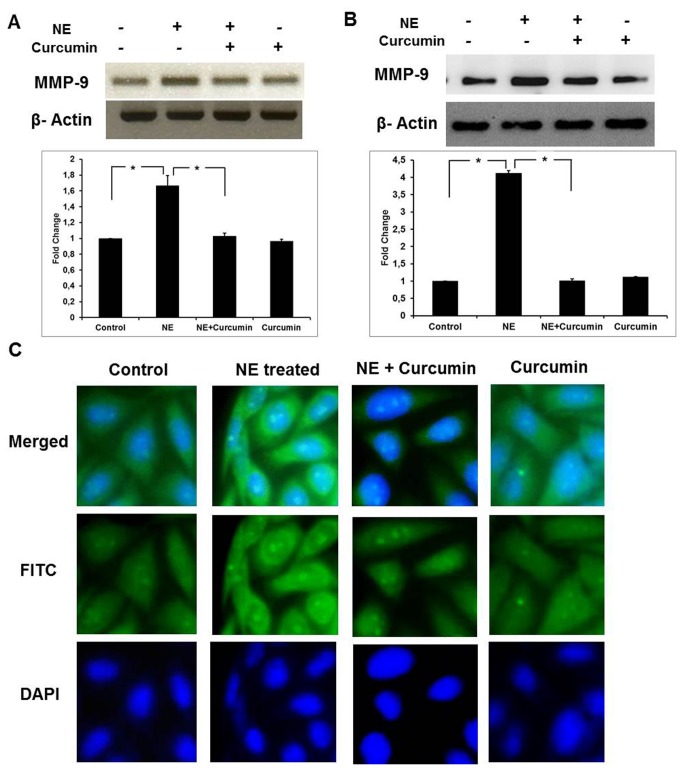
Figure 4. Expression levels of MMP-9 on curcumin treatment.
A) RT-PCR for MMP-9: mRNA expression seen through semiqunatitative RT-PCR Samples in different lanes starting from the left represented as Lane-1: Control; Lane-2: NE-treated; Lane-3: NE+Curcumin-treated; Lane-4: Curcumin-treated alone. qPCR results obtained were normalized against beta actin and plotted as a histogram (*P<0.05). B) Western Blotting for MMP-9: Samples in different lanes starting from the left represented as Lane-1: Control; Lane-2: NE-treated; Lane-3: NE+Curcumin-treated; Lane-4: Curcumin-treated alone. Protein expression observed through Western blotting was quantitated by NIH ImageJ software. Results obtained were normalized against beta actin and plotted as a histogram (*P<0.01). C) Immunocytochemistry for MMP-9: Images captured by fluoresencent microscope at 20X magnifications are represented. NE-treated group showed a significant difference compared to control and NE+Curcumin-treated group in all experiments shown in the figure.

