
Figure 5. Induction of GFP with lower ATc concentrations.
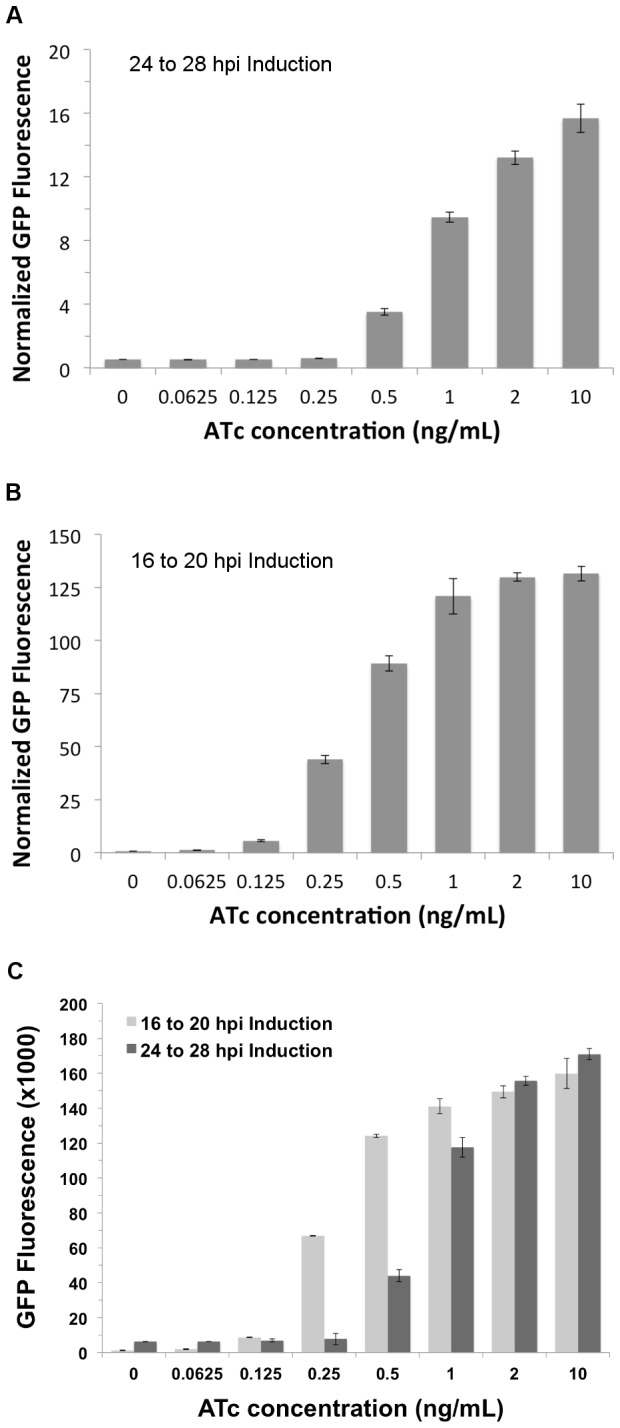
L929 cells were infected with pASK-GFP/mKate2-L2 transformed C. trachomatis. At 24 hpi, samples were induced for 4 hours with the indicated concentrations of ATc. After induction, soluble GFP and mKate2 in each sample was quantified using a microplate fluorometer. To normalize samples, GFP expression was divided by mKate2 expression and the resulting ratio was graphed (A). Increases observed in GFP fluorescence of samples induced with 0.25 ng/mL or higher were statistically significant compared to the 0 ng/mL sample (P < 0.01; Student’s t test). Induction from 16 to 20 hpi was also tested and the resulting GFP and mKate2 expression quantified as described above (B). All ATc concentrations tested for this induction period resulted in statistically significant increases in GFP expression. GFP fluorescence from the experiments shown in panels A and B are also graphed with mKate2 normalization (C). Error bars indicate standard deviation of three separate samples.