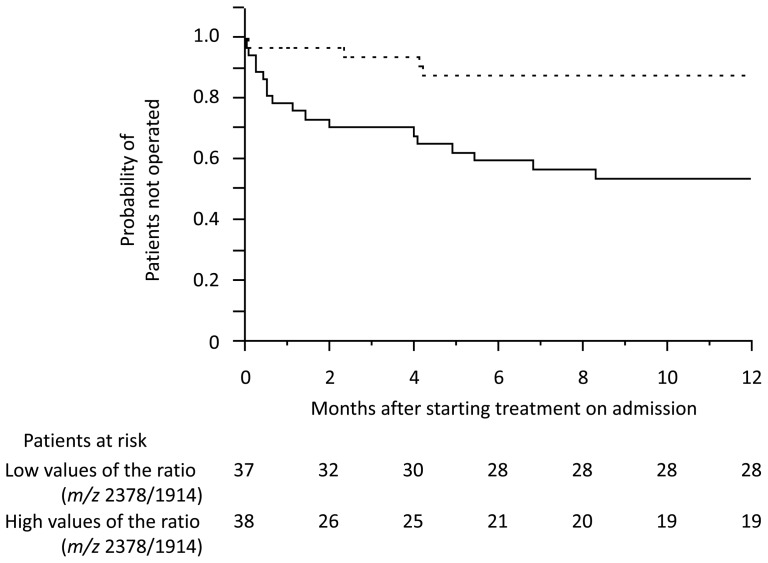
Figure 4. Clinical course of requiring surgery in patients with high and low values of the glycan ratio m/z 2378/1914.
Kaplan-Meier plot of the patients with high (solid line) and low (dotted line) values of the glycan ratio m/z 2378/1914 (cut-off: median). Time to operation was significantly shorter in patients with high values than in those with low values of the glycan ratio m/z 2378/1914 (p = 0.0006; log-rank test).

