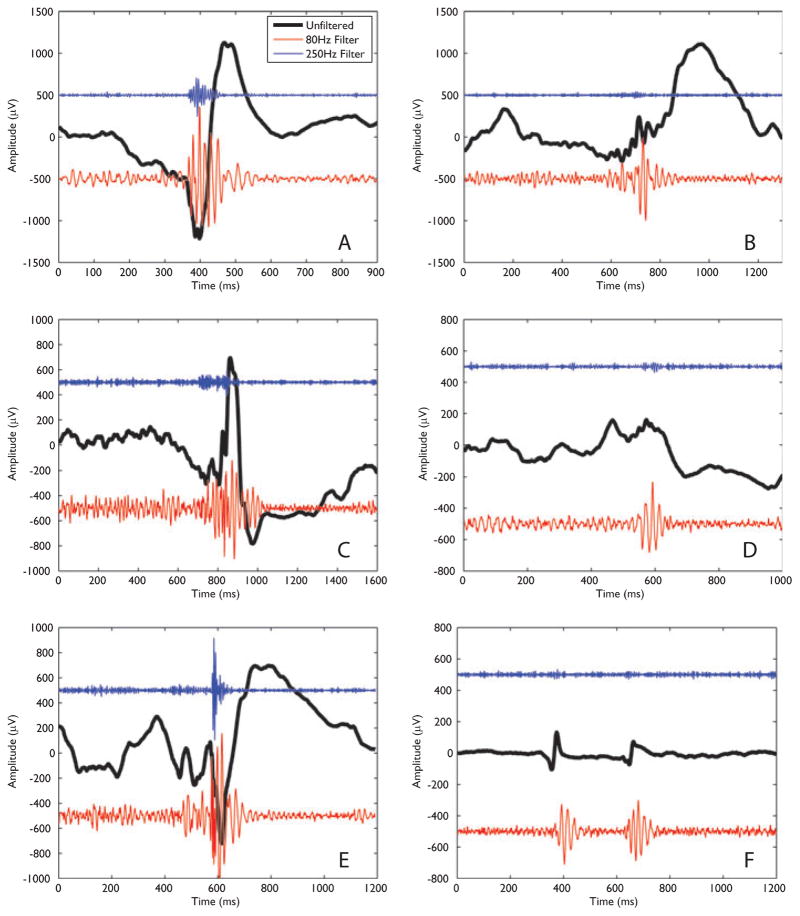
Figure 1.
Examples of ripples and fast ripples across patients and sleep stages. In each case the black trace shows the unfiltered data, whereas the lower (red) trace shows the ripple activity (80- Hz high-pass filter) and the upper (blue) trace shows the fast ripple activity (250- Hz high-pass filter). The amplitudes are as recorded, with the ripple and fast ripple activity having been multiplied by a factor of 10 to aid comparison. In addition, a constant offset has been added to separate the traces (the value of the constant was −500 μV for the ripple activity and 500 μV for the fast ripple activity). (A) Ripple and fast ripple from patient 1, contact RH1-RH2, sleep stage N3. (B) As for (A), but showing a ripple in the absence of a fast ripple. (C) Ripple and fast ripple identified in patient 5, contact LH1-LH2, stage N1-N2. (D) Data from patient 8, contact RH2-RH3, stage N3. A ripple was marked. (E) Ripple and fast ripple from patient 9, contact RA1-RA2, stage N1-N2. (F) Ripple in the absence of a fast ripple from patient 9, contact RAN2-RAN3, stage R.
Epilepsia © ILAE [Correction added after online publication 9/26/08:In Figure 1 mV is replaced by μV]

