
Figure 2.
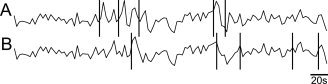
Simulated BOLD responses to epileptic spikes superimposed on background fMRI data. Vertical bars indicate random spike timings. (A) With a simulated HRF amplitude of 2% of the mean background fMRI signal value, the HRF peaks are clearly visible following the spikes. (B) Same background fMRI data, with different spike timings and HRF amplitude of only 0.5% of the mean fMRI signal value.